## Scatter Plot: Relationship Between Citations and Effect Size
### Overview
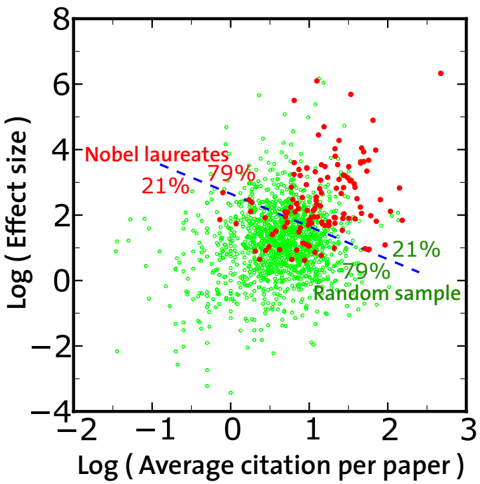
The image is a scatter plot comparing the logarithmic scale of average citations per paper (x-axis) to the logarithmic scale of effect size (y-axis). Two distinct data groups are visualized: red points labeled "Nobel laureates" and green points labeled "Random sample." A dashed blue line represents the 79% percentile threshold, with annotations indicating the distribution of data points relative to this line.
### Components/Axes
- **X-axis**: "Log (Average citation per paper)" with values ranging from -2 to 3.
- **Y-axis**: "Log (Effect size)" with values ranging from -4 to 8.
- **Legend**: Located in the top-left corner, with:
- **Red**: "Nobel laureates" (21% of data points).
- **Green**: "Random sample" (79% of data points).
- **Dashed Line**: Blue, diagonal line labeled "79%" (79% percentile threshold).
### Detailed Analysis
- **Nobel laureates (Red)**:
- Clustered predominantly in the upper-right quadrant (x > 0, y > 2).
- 21% of data points are red, with 79% of these points above the 79% percentile line.
- **Random sample (Green)**:
- Distributed across the plot but concentrated below the dashed line.
- 79% of data points are green, with most falling below the 79% percentile threshold.
- **Dashed Line**:
- Divides the plot such that 79% of all data points (both red and green) lie below it.
- Positioned diagonally from the top-left (x ≈ -2, y ≈ 4) to the bottom-right (x ≈ 2, y ≈ 0).
### Key Observations
1. **Nobel laureates** exhibit a strong positive correlation between high citations and large effect sizes, with most points above the 79% percentile line.
2. **Random sample** data points are more dispersed but predominantly below the threshold, indicating lower effect sizes relative to citations.
3. The logarithmic scales emphasize multiplicative differences, highlighting outliers (e.g., a few papers with extremely high citations/effect sizes).
### Interpretation
The plot demonstrates that Nobel laureates are disproportionately represented in the high-performing tail of both citation and effect size distributions. The 79% percentile line acts as a statistical boundary, showing that only 21% of papers (Nobel laureates) achieve effect sizes in the top quartile, while the majority (79%) of papers (random sample) fall below this threshold. This suggests that Nobel-winning research is characterized by both exceptional visibility (high citations) and significant scientific impact (large effect sizes), reinforcing the idea that high-impact work is rare but concentrated among elite researchers.