## Heatmap: Few-shot - Core Generalization - GPT-4o
### Overview
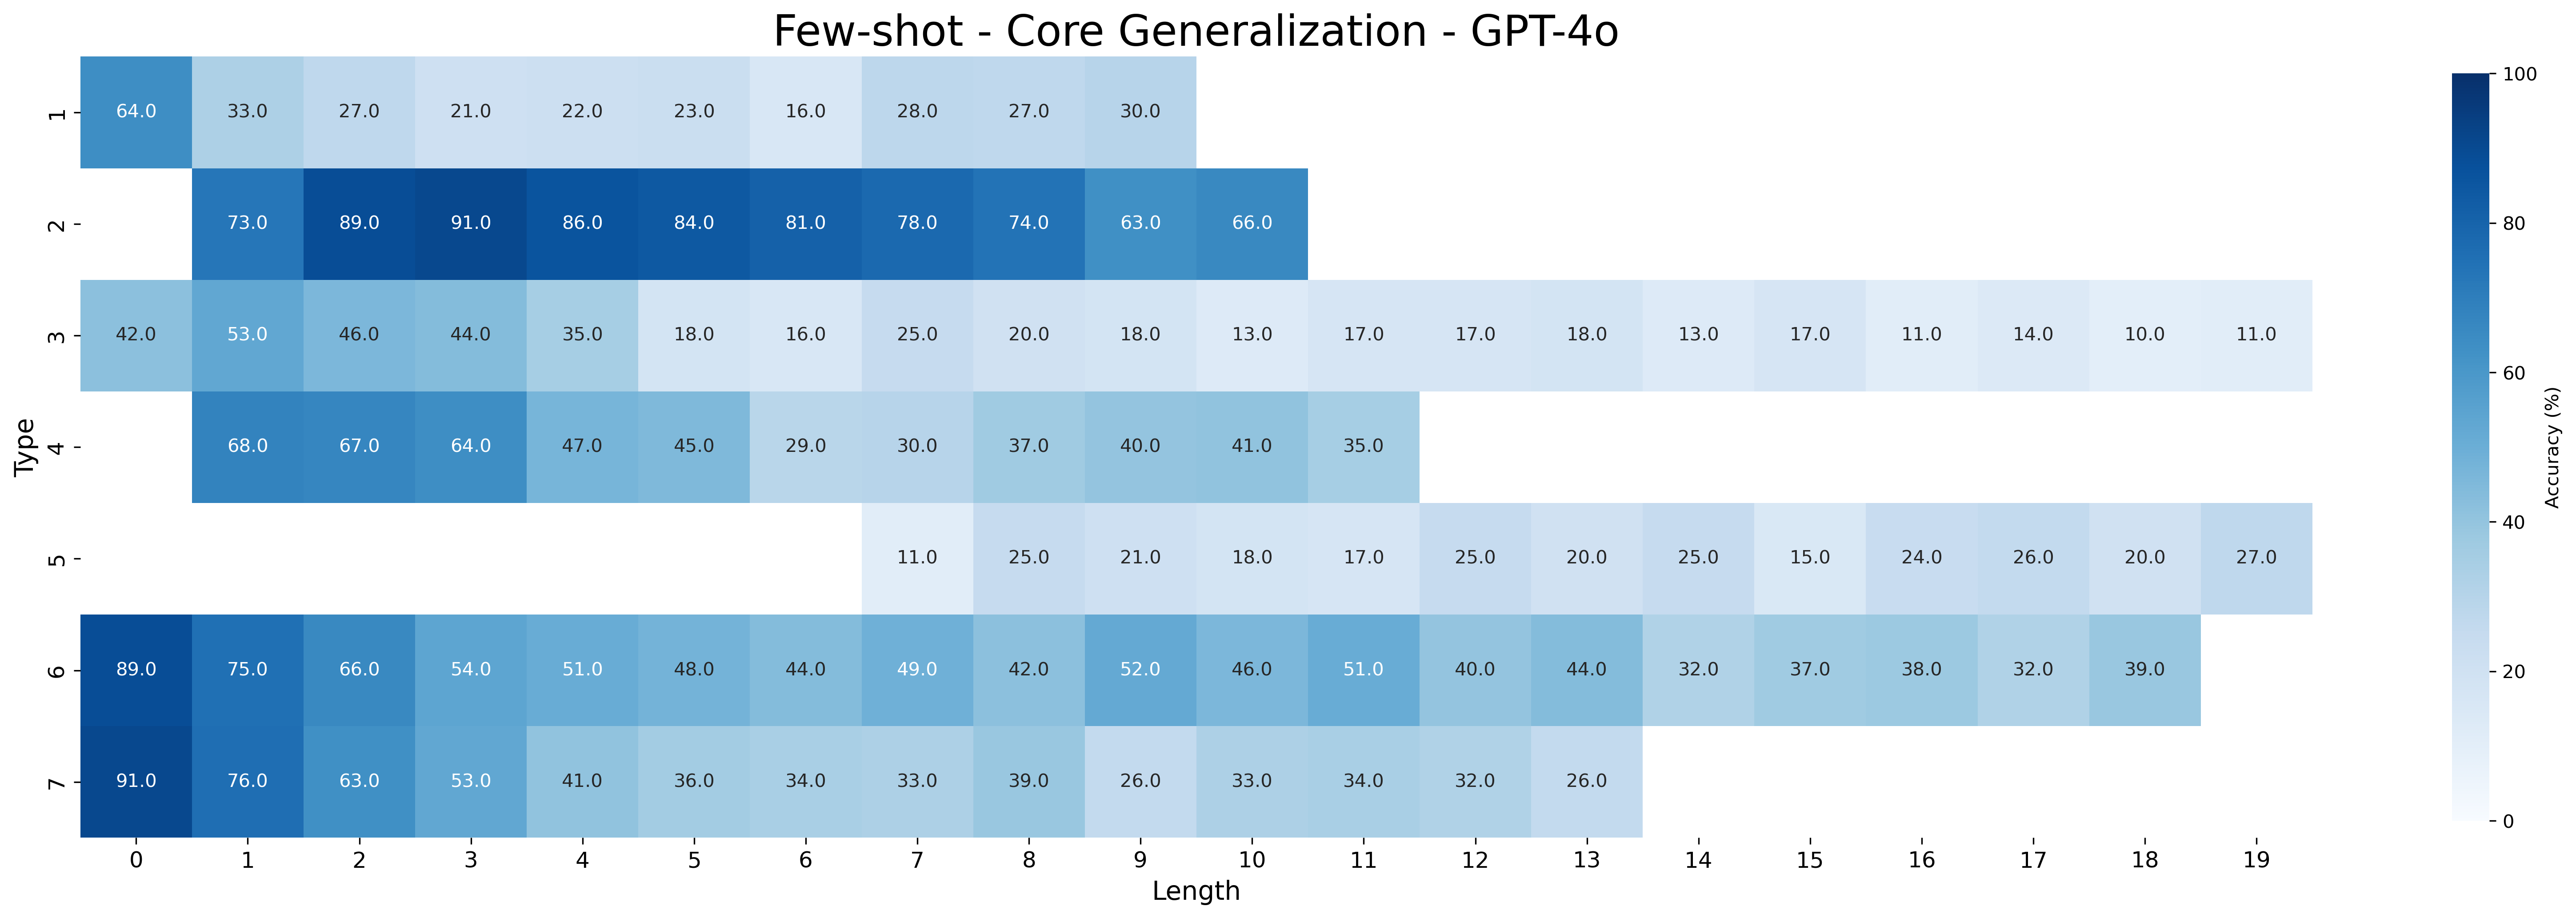
The image is a heatmap visualizing the accuracy (%) of a model (GPT-4o) across different 'Type' categories (1 to 7) and 'Length' values (0 to 19). The color intensity represents the accuracy, with darker blue indicating higher accuracy and lighter shades indicating lower accuracy.
### Components/Axes
* **Title:** Few-shot - Core Generalization - GPT-4o
* **Y-axis:** "Type" with categories labeled 1 to 7.
* **X-axis:** "Length" with values from 0 to 19.
* **Color Legend:** Located on the right side of the heatmap, showing a gradient from light blue (0%) to dark blue (100%) representing "Accuracy (%)".
### Detailed Analysis
The heatmap displays accuracy values for each combination of 'Type' and 'Length'. Here's a breakdown of the accuracy values for each 'Type' across different 'Length' values:
* **Type 1:**
* Length 0: 64.0%
* Length 1: 33.0%
* Length 2: 27.0%
* Length 3: 21.0%
* Length 4: 22.0%
* Length 5: 23.0%
* Length 6: 16.0%
* Length 7: 28.0%
* Length 8: 27.0%
* Length 9: 30.0%
* **Type 2:**
* Length 1: 73.0%
* Length 2: 89.0%
* Length 3: 91.0%
* Length 4: 86.0%
* Length 5: 84.0%
* Length 6: 81.0%
* Length 7: 78.0%
* Length 8: 74.0%
* Length 9: 63.0%
* Length 10: 66.0%
* **Type 3:**
* Length 0: 42.0%
* Length 1: 53.0%
* Length 2: 46.0%
* Length 3: 44.0%
* Length 4: 35.0%
* Length 5: 18.0%
* Length 6: 16.0%
* Length 7: 25.0%
* Length 8: 20.0%
* Length 9: 18.0%
* Length 10: 13.0%
* Length 11: 17.0%
* Length 12: 17.0%
* Length 13: 18.0%
* Length 14: 13.0%
* Length 15: 17.0%
* Length 16: 11.0%
* Length 17: 14.0%
* Length 18: 10.0%
* Length 19: 11.0%
* **Type 4:**
* Length 1: 68.0%
* Length 2: 67.0%
* Length 3: 64.0%
* Length 4: 47.0%
* Length 5: 45.0%
* Length 6: 29.0%
* Length 7: 30.0%
* Length 8: 37.0%
* Length 9: 40.0%
* Length 10: 41.0%
* Length 11: 35.0%
* **Type 5:**
* Length 7: 11.0%
* Length 8: 25.0%
* Length 9: 21.0%
* Length 10: 18.0%
* Length 11: 17.0%
* Length 12: 25.0%
* Length 13: 20.0%
* Length 14: 25.0%
* Length 15: 15.0%
* Length 16: 24.0%
* Length 17: 26.0%
* Length 18: 20.0%
* Length 19: 27.0%
* **Type 6:**
* Length 0: 89.0%
* Length 1: 75.0%
* Length 2: 66.0%
* Length 3: 54.0%
* Length 4: 51.0%
* Length 5: 48.0%
* Length 6: 44.0%
* Length 7: 49.0%
* Length 8: 42.0%
* Length 9: 52.0%
* Length 10: 46.0%
* Length 11: 51.0%
* Length 12: 40.0%
* Length 13: 44.0%
* Length 14: 32.0%
* Length 15: 37.0%
* Length 16: 38.0%
* Length 17: 32.0%
* Length 18: 39.0%
* **Type 7:**
* Length 0: 91.0%
* Length 1: 76.0%
* Length 2: 63.0%
* Length 3: 53.0%
* Length 4: 41.0%
* Length 5: 36.0%
* Length 6: 34.0%
* Length 7: 33.0%
* Length 8: 39.0%
* Length 9: 26.0%
* Length 10: 33.0%
* Length 11: 34.0%
* Length 12: 32.0%
* Length 13: 26.0%
### Key Observations
* Types 2, 6, and 7 generally exhibit higher accuracy compared to other types.
* Accuracy tends to decrease as 'Length' increases for most 'Type' categories.
* Type 5 has the lowest accuracy values overall.
* Types 1, 3, 5 have missing data for certain 'Length' values.
### Interpretation
The heatmap provides insights into the performance of the GPT-4o model in a few-shot learning scenario. The "Type" likely represents different categories or types of tasks, and "Length" could refer to the length of the input sequence or the number of examples provided in the few-shot setting.
The data suggests that the model performs better on certain types of tasks (Types 2, 6, and 7) compared to others (Type 5). The decreasing accuracy with increasing "Length" could indicate that the model struggles with longer sequences or requires more examples to maintain performance. The missing data for some 'Type' and 'Length' combinations might indicate that those specific scenarios were not tested or are not applicable.
Overall, the heatmap highlights the strengths and weaknesses of the GPT-4o model in few-shot core generalization, providing valuable information for further analysis and improvement.