## Heatmap: Few-shot - Core Generalization - GPT-4o
### Overview
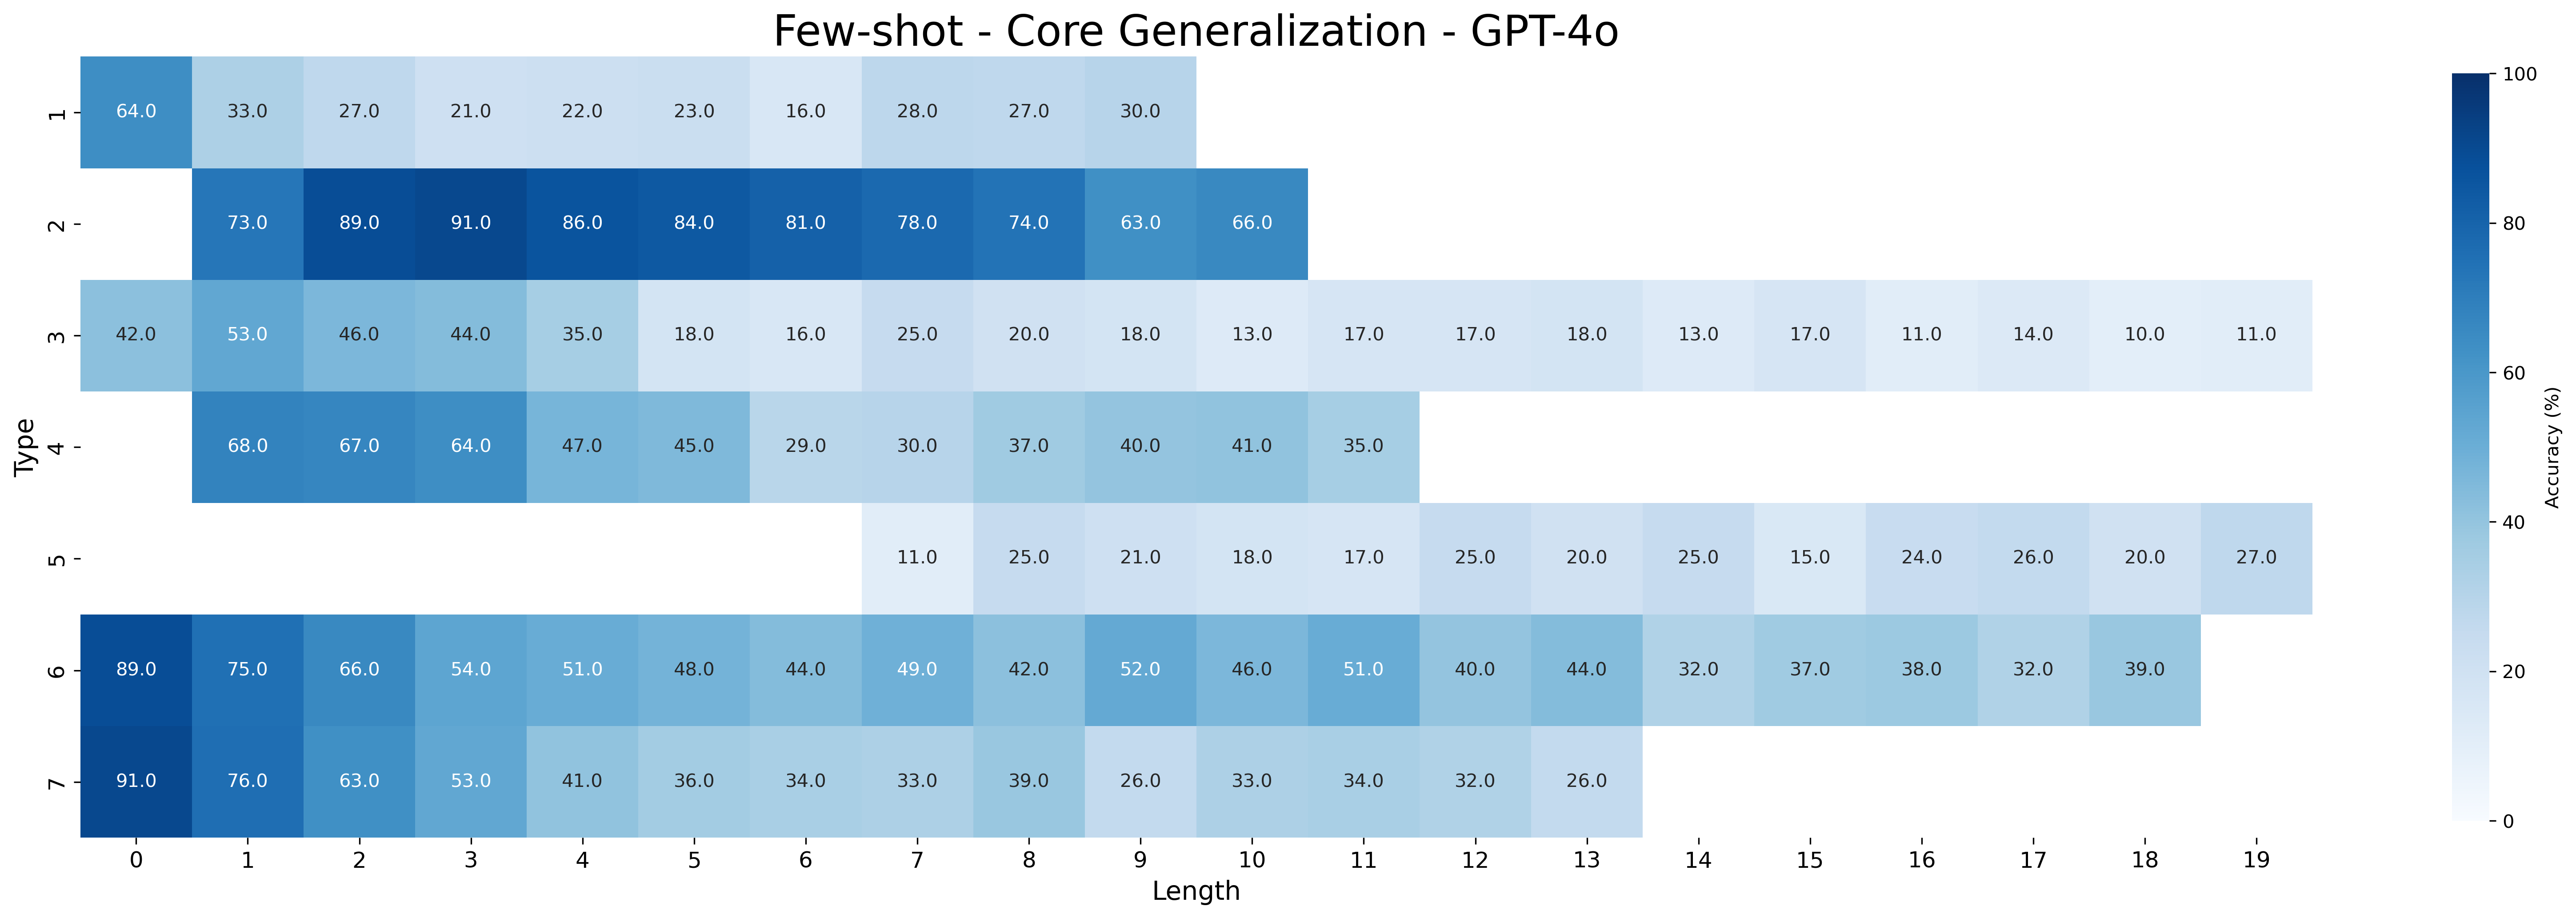
This heatmap visualizes the accuracy of GPT-4o across different 'Type' categories and 'Length' values. The color intensity represents the accuracy percentage, ranging from 0% (white) to 100% (dark blue). The heatmap is designed to show how well the model generalizes based on the length of the input and the type of task.
### Components/Axes
* **Title:** "Few-shot - Core Generalization - GPT-4o" (Top-center)
* **X-axis:** "Length" - Values range from 0 to 19, in integer increments. (Bottom)
* **Y-axis:** "Type" - Categories are: '1', '2', '3', '4', '5', '6', '7' (Left)
* **Color Scale:** A gradient from white (0%) to dark blue (100%) representing accuracy. The scale is positioned on the right side of the heatmap, with numerical values indicating the corresponding accuracy percentage.
### Detailed Analysis
The heatmap displays accuracy values for each combination of 'Type' and 'Length'. I will analyze each 'Type' row and describe the trends.
* **Type 1:** Accuracy starts at approximately 91.0% (Length 0), decreases to around 41.0% (Length 4), then increases slightly to 36.0% (Length 5), and remains relatively stable around 33.0-39.0% for Lengths 6-19.
* **Type 2:** Accuracy begins at 89.0% (Length 0), decreases to 51.0% (Length 4), then increases to 48.0% (Length 5), and remains relatively stable around 40.0-49.0% for Lengths 6-19.
* **Type 3:** Accuracy starts at 85.0% (Length 0), decreases to 46.0% (Length 4), then increases to 44.0% (Length 5), and remains relatively stable around 32.0-42.0% for Lengths 6-19.
* **Type 4:** Accuracy begins at 68.0% (Length 0), decreases to 47.0% (Length 4), then increases to 45.0% (Length 5), and remains relatively stable around 30.0-40.0% for Lengths 6-19.
* **Type 5:** Accuracy starts at 11.0% (Length 6), increases to 25.0% (Length 7), then remains relatively stable around 17.0-25.0% for Lengths 8-19.
* **Type 6:** Accuracy starts at 64.0% (Length 0), decreases to 27.0% (Length 4), then increases to 23.0% (Length 5), and remains relatively stable around 16.0-30.0% for Lengths 6-19.
* **Type 7:** Accuracy begins at 75.0% (Length 0), decreases to 41.0% (Length 4), then increases to 36.0% (Length 5), and remains relatively stable around 32.0-39.0% for Lengths 6-19.
Here's a table summarizing some key data points:
| Type | Length 0 | Length 4 | Length 5 | Length 10 | Length 19 |
|---|---|---|---|---|---|
| 1 | 91.0% | 41.0% | 36.0% | 33.0% | 36.0% |
| 2 | 89.0% | 51.0% | 48.0% | 42.0% | 44.0% |
| 3 | 85.0% | 46.0% | 44.0% | 40.0% | 39.0% |
| 4 | 68.0% | 47.0% | 45.0% | 37.0% | 35.0% |
| 5 | N/A | N/A | N/A | 21.0% | 20.0% |
| 6 | 64.0% | 27.0% | 23.0% | 26.0% | 27.0% |
| 7 | 75.0% | 41.0% | 36.0% | 33.0% | 32.0% |
### Key Observations
* Accuracy generally decreases as 'Length' increases from 0 to 4 for most 'Type' categories.
* After Length 4, the accuracy tends to plateau or fluctuate within a relatively narrow range.
* Type 5 has significantly lower accuracy values compared to other types, and only has data starting at Length 6.
* Type 1 and Type 2 consistently exhibit the highest accuracy values across most lengths.
* There is a noticeable dip in accuracy for all types between Length 0 and Length 4.
### Interpretation
The heatmap suggests that GPT-4o performs best on shorter inputs (Length 0) for most task types. As the input length increases, the model's accuracy tends to decline, indicating a potential challenge in maintaining performance with longer sequences. The plateauing of accuracy after Length 4 suggests that the model reaches a limit in its ability to effectively process and generalize from longer inputs. The lower accuracy of Type 5 could indicate that this task type is inherently more difficult for the model, or that the few-shot learning setup is less effective for this type. The consistent high performance of Types 1 and 2 suggests these task types are well-suited to the model's capabilities. The initial drop in accuracy as length increases could be due to the model struggling to maintain context or identify relevant information within longer sequences. This data is valuable for understanding the model's strengths and weaknesses and for guiding the development of strategies to improve its generalization performance on longer and more complex inputs.