## Diagram: Vector Field Representation
### Overview
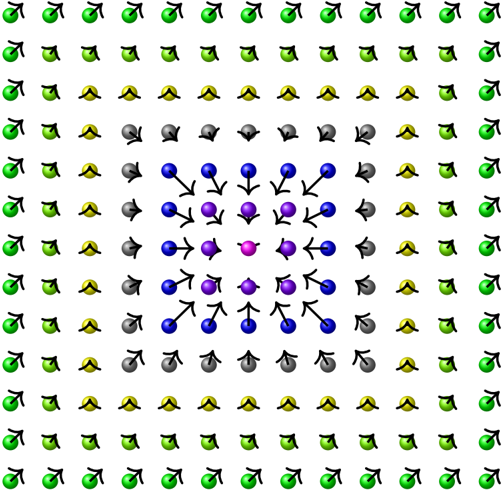
The image displays a 15x15 grid of spheres, each accompanied by a directional arrow. The grid is organized symmetrically around a central point. The spheres are color-coded in concentric layers, and the arrows consistently point radially outward from the center, creating a visual representation of a vector field with a positive divergence (a "source"). There is no text present in this image.
### Components/Axes
* **Grid Structure:** A square grid consisting of 15 rows and 15 columns (225 total points).
* **Spheres:** Each grid intersection contains a sphere.
* **Arrows:** Each sphere (except the center) has an arrow attached, indicating a specific direction.
* **Color Coding:** The spheres are colored based on their distance from the center, creating a gradient effect.
### Detailed Analysis
The grid is organized into concentric layers radiating from the center. The arrows consistently point away from the center, with the angle of the arrow corresponding to its position relative to the origin.
**Layer Breakdown (from center outward):**
1. **Center (Origin):**
* **Color:** Magenta.
* **Components:** A single sphere located at the exact center of the grid.
* **Arrows:** None.
2. **Layer 1 (Immediate neighbors):**
* **Color:** Purple.
* **Components:** 8 spheres forming a 3x3 square around the center.
* **Arrows:** Point directly away from the center (up, down, left, right, and diagonals).
3. **Layer 2:**
* **Color:** Blue.
* **Components:** 16 spheres forming a 5x5 square perimeter.
* **Arrows:** Point radially outward.
4. **Layer 3:**
* **Color:** Grey.
* **Components:** 24 spheres forming a 7x7 square perimeter.
* **Arrows:** Point radially outward.
5. **Layer 4:**
* **Color:** Yellow.
* **Components:** 32 spheres forming a 9x9 square perimeter.
* **Arrows:** Point radially outward.
6. **Outer Layers (Layers 5, 6, and 7):**
* **Color:** Green.
* **Components:** The remaining spheres forming the outer boundaries of the 15x15 grid.
* **Arrows:** Point radially outward.
### Key Observations
* **Symmetry:** The diagram exhibits perfect radial and reflectional symmetry across both horizontal and vertical axes.
* **Vector Consistency:** The arrows represent a uniform outward flow. The magnitude of the vectors (represented by arrow length) appears visually consistent across the grid, though the angular direction changes to maintain the radial outward pattern.
* **Color Gradient:** The color scheme transitions from warm/saturated (Magenta/Purple) at the center to cool/neutral (Grey) to bright/saturated (Yellow/Green) at the periphery.
### Interpretation
This image is a classic visualization of a **positive divergence** or a **source** in a vector field.
* **Mathematical/Physical Meaning:** In physics or fluid dynamics, this represents a point from which a quantity (like fluid, heat, or an electric field) is emanating. The magenta center acts as the "source."
* **Visual Logic:** The use of concentric color rings helps the viewer distinguish the distance from the source. The arrows provide the directional data, confirming that the "flow" is moving away from the center.
* **Peircean/Semiotic Analysis:** The image functions as an icon of a mathematical concept. It does not require text to convey its meaning because it relies on the universal visual language of vector fields—where arrows indicate direction and the grid structure provides the spatial context. The transition from the magenta center to the green periphery suggests a "decay" or "expansion" of the influence of the source as distance increases.