\n
## Diagram: Molecular Structure/Arrangement
### Overview
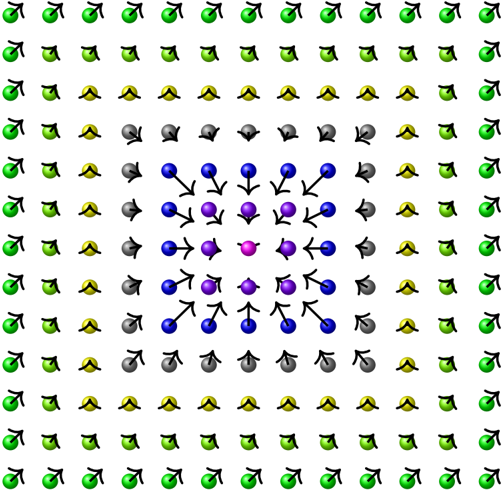
The image depicts a two-dimensional representation of a molecular structure or arrangement. It features a central cluster of colored spheres (blue, purple, and magenta) connected by arrows, surrounded by a grid of smaller spheres in green, yellow, and gray. The arrangement appears symmetrical, with the central cluster as a focal point. There are no explicit axes or labels, making quantitative analysis impossible.
### Components/Axes
The diagram consists of the following components:
* **Central Cluster:** Composed of spheres in three colors: blue, purple, and magenta. These spheres are interconnected by arrows.
* **Surrounding Grid:** A grid of spheres in three colors: green, yellow, and gray. These spheres are arranged in a regular pattern around the central cluster.
* **Arrows:** Black arrows connect the spheres within the central cluster, indicating a relationship or interaction between them.
* **Background:** A white background provides contrast for the colored spheres and arrows.
There are no axes, scales, or legends present in the image.
### Detailed Analysis or Content Details
The central cluster contains:
* Four blue spheres positioned at the cardinal directions (North, South, East, West).
* Four purple spheres positioned diagonally between the blue spheres.
* One magenta sphere located at the very center of the cluster.
The arrows connect each blue sphere to the central magenta sphere, and each purple sphere to the central magenta sphere.
The surrounding grid consists of approximately 8x8 spheres. The distribution of colors in the grid appears to be roughly uniform, with green spheres predominating at the corners and edges, yellow spheres scattered throughout, and gray spheres interspersed.
There is no numerical data present in the image. The arrangement is purely visual.
### Key Observations
* The central cluster exhibits a clear symmetry, with the blue and purple spheres arranged in a square pattern around the central magenta sphere.
* The arrows suggest a flow or interaction from the blue and purple spheres towards the central magenta sphere.
* The surrounding grid appears to act as a background or supporting structure for the central cluster.
* The color distribution in the grid is not perfectly uniform, with a higher concentration of green spheres at the periphery.
### Interpretation
The diagram likely represents a simplified model of a molecular structure or a chemical reaction. The central cluster could represent a core molecule or a reactive center, while the surrounding grid could represent solvent molecules or a supporting matrix. The arrows suggest that the blue and purple spheres are donating or interacting with the central magenta sphere.
The symmetry of the central cluster suggests a stable or energetically favorable configuration. The color differences between the spheres could represent different elements or functional groups.
Without additional information, it is difficult to determine the specific meaning of the diagram. However, it provides a visual representation of a complex system with interconnected components. The diagram could be used to illustrate concepts in chemistry, physics, or materials science. The lack of quantitative data limits the depth of analysis. It is a qualitative representation of a system, rather than a precise measurement.