## Line Graph: Accuracy vs. Logical Coherence Trade-off (10-Axiom)
### Overview
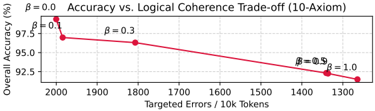
The image is a line graph illustrating the trade-off between overall accuracy and logical coherence as a function of targeted errors per 10,000 tokens. The graph shows a single red line connecting five data points, each labeled with a β (beta) value. The x-axis represents "Targeted Errors / 10k Tokens" (ranging from 1300 to 2000), and the y-axis represents "Overall Accuracy (%)" (ranging from 92.5% to 97.5%). The legend on the right maps β values (0.0, 0.1, 0.3, 0.5, 1.0) to specific data points.
### Components/Axes
- **X-axis**: "Targeted Errors / 10k Tokens" (values: 1300, 1400, 1500, 1600, 1700, 1800, 1900, 2000).
- **Y-axis**: "Overall Accuracy (%)" (values: 92.5%, 93.0%, 93.5%, 94.0%, 94.5%, 95.0%, 95.5%, 96.0%, 96.5%, 97.0%, 97.5%).
- **Legend**: Located on the right, with β values (0.0, 0.1, 0.3, 0.5, 1.0) mapped to distinct data points.
- **Line**: A single red line connects all data points, showing a downward trend.
### Detailed Analysis
- **Data Points**:
- β = 0.0: (2000, 97.5%)
- β = 0.1: (1900, ~97.0%)
- β = 0.3: (1800, ~96.5%)
- β = 0.5: (1700, ~96.0%)
- β = 1.0: (1300, 92.5%)
- **Trend**: The red line slopes downward linearly from left to right, indicating a consistent decrease in accuracy as targeted errors decrease (β increases).
### Key Observations
1. **Linear Relationship**: The trade-off between accuracy and logical coherence is linear, with no curvature in the line.
2. **Accuracy Decline**: Accuracy drops by ~5% as targeted errors decrease from 2000 to 1300 tokens.
3. **β Parameter**: Higher β values correspond to lower targeted errors and lower accuracy, suggesting β controls the balance between accuracy and coherence.
### Interpretation
The graph demonstrates that reducing targeted errors (via higher β values) improves logical coherence but reduces overall accuracy. This trade-off implies that optimizing for coherence (e.g., in AI models) may come at the cost of accuracy. The linear trend suggests a predictable, proportional relationship between β and the trade-off effect. The absence of other lines in the graph (despite the legend listing multiple β values) may indicate a simplified visualization or focus on a single β trajectory.