## Line Graph: Accuracy vs. Logical Coherence Trade-off (10-Axiom)
### Overview
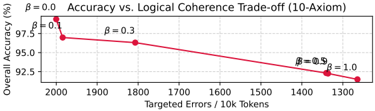
The image displays a line graph illustrating the trade-off between "Overall Accuracy" and "Targeted Errors" for a system or model described as "10-Axiom". The graph plots a single, downward-sloping red line, showing that as the number of targeted errors decreases (moving right on the x-axis), the overall accuracy also decreases. Data points are annotated with a parameter `β` (beta), which increases along the curve.
### Components/Axes
* **Title:** "Accuracy vs. Logical Coherence Trade-off (10-Axiom)" (centered at the top).
* **Y-Axis (Vertical):**
* **Label:** "Overall Accuracy (%)"
* **Scale:** Linear scale ranging from 92.5 to 97.5, with major ticks at 92.5, 95.0, and 97.5.
* **X-Axis (Horizontal):**
* **Label:** "Targeted Errors / 10k Tokens"
* **Scale:** Linear scale, but values decrease from left to right. Major ticks are at 2000, 1900, 1800, 1700, 1600, 1500, 1400, and 1300.
* **Legend:** Located in the top-left corner. It shows a red line symbol next to the text "β = 0.0". This appears to define the line style/color for the plotted series.
* **Data Series:** A single solid red line with circular markers at four specific data points. Each point is annotated with a `β` value.
### Detailed Analysis
The graph plots a clear negative correlation. The line originates at the top-left and slopes downward to the bottom-right.
**Data Points & Annotations (from left to right):**
1. **Point 1 (Top-Left):**
* **X (Targeted Errors):** ~2000 per 10k Tokens
* **Y (Overall Accuracy):** ~97.5%
* **Annotation:** `β = 0.0` (placed above and to the left of the point).
2. **Point 2:**
* **X:** ~1900 per 10k Tokens
* **Y:** ~96.5%
* **Annotation:** `β = 0.3` (placed above the point).
3. **Point 3:**
* **X:** ~1500 per 10k Tokens
* **Y:** ~95.0%
* **Annotation:** `β = 0.5` (placed above the point).
4. **Point 4 (Bottom-Right):**
* **X:** ~1300 per 10k Tokens
* **Y:** ~92.5%
* **Annotation:** `β = 1.0` (placed to the right of the point).
**Trend Verification:** The line has a consistent negative slope. As the x-value (Targeted Errors) decreases by approximately 700 units (from 2000 to 1300), the y-value (Accuracy) decreases by approximately 5 percentage points (from 97.5% to 92.5%).
### Key Observations
1. **Inverse Relationship:** There is a direct, inverse relationship between the two metrics. Improving logical coherence (by reducing targeted errors) comes at the cost of overall system accuracy.
2. **Parameter `β`:** The parameter `β` increases monotonically from 0.0 to 1.0 as we move along the curve from high-accuracy/high-error to low-accuracy/low-error. This suggests `β` is a control parameter that adjusts the trade-off between these two objectives.
3. **Non-Linear Decline:** The slope of the line appears slightly steeper between `β=0.0` and `β=0.3` compared to the segment between `β=0.5` and `β=1.0`, though the overall trend is roughly linear.
### Interpretation
This graph visualizes a fundamental optimization dilemma in the evaluated "10-Axiom" system. The data suggests that the system's objectives of maximizing accuracy and minimizing logical errors are in conflict.
* **What the data means:** The parameter `β` likely acts as a weighting factor in a loss function or a hyperparameter that prioritizes one objective over the other. A `β` of 0.0 (`β = 0.0`) prioritizes accuracy, resulting in high performance (97.5%) but a high error rate (2000/10k tokens). Conversely, a `β` of 1.0 (`β = 1.0`) heavily prioritizes logical coherence, drastically reducing errors to ~1300/10k tokens but causing accuracy to drop to 92.5%.
* **Why it matters:** This trade-off curve is crucial for system deployment. It allows a user to select an operating point based on their specific needs. For applications where correctness is paramount (e.g., factual QA), a lower `β` might be chosen. For applications where logical consistency is critical (e.g., formal reasoning, theorem proving), a higher `β` would be preferable, accepting the lower overall accuracy.
* **Underlying Implication:** The existence of this smooth trade-off curve indicates that accuracy and logical coherence are not perfectly aligned goals for this model. Improving one inherently degrades the other within the current model architecture or training paradigm. The "10-Axiom" label may refer to a specific set of logical constraints or rules the model is being evaluated against.