## Logical Diagram: Query for Non-European and Non-North American Nobel Prize Winners
### Overview
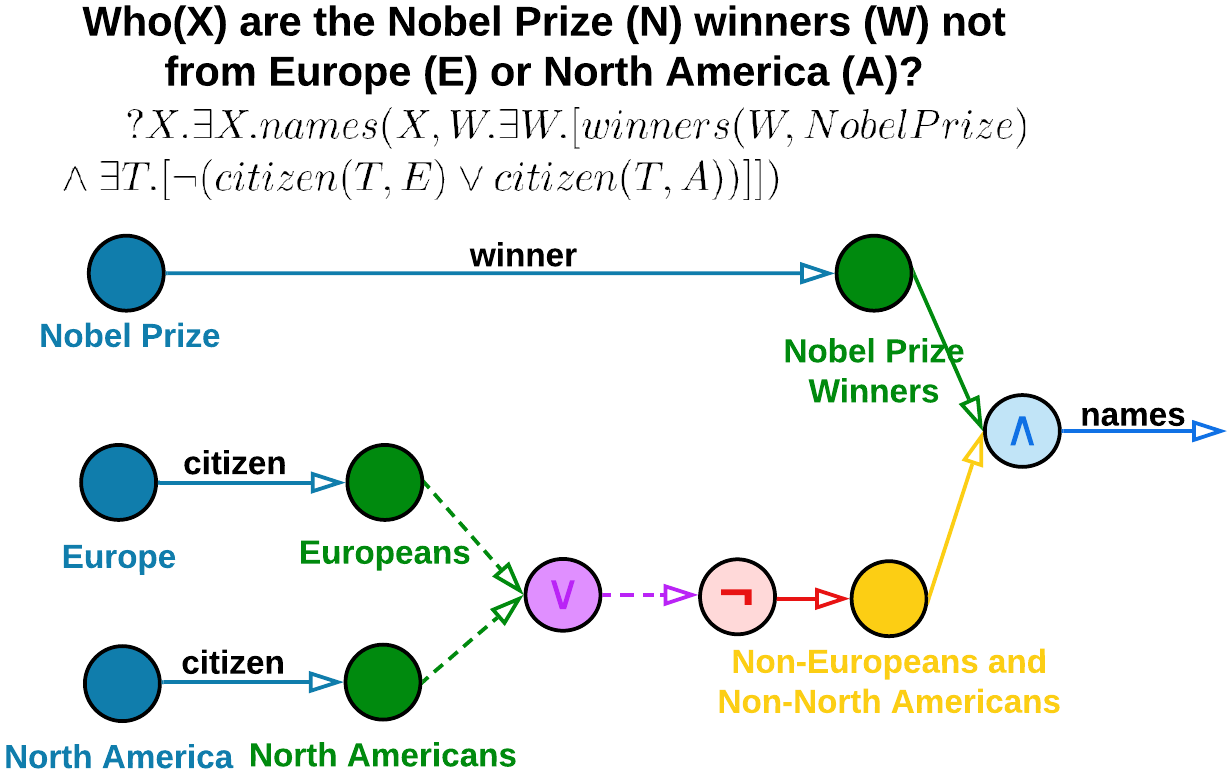
The image is a conceptual diagram illustrating the logical structure of a query. The query asks: "Who(X) are the Nobel Prize (N) winners (W) not from Europe (E) or North America (A)?" It visually maps the relationships between entities (regions, people) and logical operations (conjunction, disjunction, negation) required to answer this question. The diagram is not a data chart but a flowchart for a knowledge base query.
### Components/Axes
The diagram is composed of labeled nodes (circles) connected by directed arrows representing relationships. The elements are spatially arranged to show a logical flow from left to right.
**1. Header (Top):**
* **Title Text:** "Who(X) are the Nobel Prize (N) winners (W) not from Europe (E) or North America (A)?"
* **Formal Logic Expression:** `?X.∃X.names(X, W.∃W.[winners(W, NobelPrize) ∧ ∃T.[¬(citizen(T, E) ∨ citizen(T, A))]])`
* *Note: This is formal logical syntax, not a natural language.*
**2. Diagram Nodes & Labels (Left to Right, Top to Bottom):**
* **Blue Circle (Top-Left):** Label: "Nobel Prize"
* **Blue Circle (Middle-Left):** Label: "Europe"
* **Blue Circle (Bottom-Left):** Label: "North America"
* **Green Circle (Top-Right):** Label: "Nobel Prize Winners"
* **Green Circle (Middle, connected to Europe):** Label: "Europeans"
* **Green Circle (Bottom, connected to North America):** Label: "North Americans"
* **Purple Circle (Center):** Contains the logical symbol "∨" (OR).
* **Pink Circle (Center-Right):** Contains the logical symbol "¬" (NOT).
* **Yellow Circle (Right):** Label: "Non-Europeans and Non-North Americans"
* **Light Blue Circle (Far Right):** Contains the logical symbol "∧" (AND). An arrow from this node points right with the label "names".
**3. Relationship Arrows & Labels:**
* Arrow from "Nobel Prize" to "Nobel Prize Winners": Label: "winner"
* Arrow from "Europe" to "Europeans": Label: "citizen"
* Arrow from "North America" to "North Americans": Label: "citizen"
* Dashed green arrows from "Europeans" and "North Americans" point to the purple "∨" (OR) node.
* A dashed purple arrow points from the "∨" node to the pink "¬" (NOT) node.
* A solid red arrow points from the "¬" node to the yellow "Non-Europeans and Non-North Americans" node.
* A solid green arrow points from "Nobel Prize Winners" to the light blue "∧" (AND) node.
* A solid yellow arrow points from "Non-Europeans and Non-North Americans" to the same light blue "∧" (AND) node.
### Detailed Analysis
The diagram visually deconstructs the logical query into its constituent parts and operations:
1. **Entity Definition:** It defines base entities (Nobel Prize, Europe, North America) and derived groups (Nobel Prize Winners, Europeans, North Americans) via "winner" and "citizen" relationships.
2. **Logical Operations:**
* **Disjunction (∨):** The set of "Europeans" and "North Americans" are combined using the logical OR operation.
* **Negation (¬):** The result of the OR operation is negated, creating the set of individuals who are **not** (European OR North American). This is labeled "Non-Europeans and Non-North Americans".
* **Conjunction (∧):** The set of "Nobel Prize Winners" is intersected (AND) with the set of "Non-Europeans and Non-North Americans". The result of this conjunction is the answer set.
3. **Query Output:** The final arrow labeled "names" from the conjunction node indicates that the query seeks the names (X) of the individuals in this final intersected set.
### Key Observations
* **Color Coding:** Colors are used semantically: Blue for source regions, Green for derived population groups, Purple/Pink/Yellow for logical operations and results, Light Blue for the final conjunction.
* **Spatial Flow:** The layout guides the viewer from left (inputs) through center (processing/logic) to right (output), mirroring the logical evaluation order.
* **Formal vs. Visual:** The diagram provides a visual, intuitive counterpart to the dense formal logic expression at the top, making the query's structure easier to grasp.
### Interpretation
This diagram is a pedagogical or design tool for knowledge representation and query planning. It demonstrates how a complex natural language question can be systematically broken down into a sequence of set-theoretic and logical operations over a knowledge base.
* **What it demonstrates:** It shows the stepwise construction of a target set (X) by first defining prerequisite sets (Winners, Europeans, North Americans), applying logical filters (NOT (Europeans OR North Americans)), and finally intersecting the filtered set with the Winners set.
* **Relationships:** The arrows explicitly define the predicates (`winner`, `citizen`) that connect entities in the underlying knowledge graph. The logical nodes (∨, ¬, ∧) show how these sets are combined.
* **Notable Structure:** The use of the intermediate yellow node "Non-Europeans and Non-North Americans" is a key visual aid. It explicitly represents the result of the negation before the final conjunction, clarifying a step that is compressed in the formal logic string.
* **Purpose:** The diagram's purpose is to bridge the gap between human-readable questions and machine-executable logical queries, ensuring the query's semantics are correctly captured and visualized before implementation. It acts as a blueprint for querying a structured database or knowledge graph.