## Line Chart: Validation Score vs. Training Step (Benchmark: AIME24)
### Overview
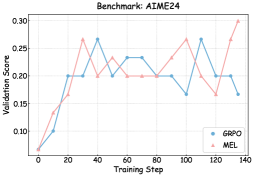
This image presents a line chart illustrating the validation score of two models, GRPD and MEL, as a function of the training step. The chart appears to track the performance of these models during a training process on the AIME24 benchmark.
### Components/Axes
* **Title:** Benchmark: AIME24 (positioned at the top-center)
* **X-axis:** Training Step (ranging from approximately 0 to 140, with tick marks at intervals of 20)
* **Y-axis:** Validation Score (ranging from approximately 0.10 to 0.30, with tick marks at intervals of 0.05)
* **Legend:** Located in the bottom-right corner.
* GRP0 (represented by a blue line with circular markers)
* MEL (represented by a pink line with triangular markers)
* **Gridlines:** Faint gray horizontal and vertical gridlines are present to aid in reading values.
### Detailed Analysis
**GRP0 (Blue Line):**
The GRP0 line generally fluctuates throughout the training process. It starts at approximately 0.08 at a training step of 0, increases to a peak of around 0.27 at a training step of 40, then decreases and oscillates between approximately 0.18 and 0.24 until a training step of 120. Finally, it decreases to approximately 0.20 at a training step of 140.
Approximate data points:
* (0, 0.08)
* (20, 0.20)
* (40, 0.27)
* (60, 0.23)
* (80, 0.20)
* (100, 0.26)
* (120, 0.18)
* (140, 0.20)
**MEL (Pink Line):**
The MEL line also exhibits fluctuations, but with a different pattern. It starts at approximately 0.08 at a training step of 0, increases steadily to around 0.27 at a training step of 40, then decreases to approximately 0.18 at a training step of 80. It then increases again, reaching a peak of around 0.29 at a training step of 120, and finally decreases to approximately 0.28 at a training step of 140.
Approximate data points:
* (0, 0.08)
* (20, 0.16)
* (40, 0.27)
* (60, 0.22)
* (80, 0.18)
* (100, 0.25)
* (120, 0.29)
* (140, 0.28)
### Key Observations
* Both models start with a similar validation score.
* Both models show improvement in validation score during the initial training steps (up to approximately step 40).
* After step 40, the models' performance diverges, with GRP0 exhibiting more pronounced oscillations.
* MEL consistently achieves a higher validation score than GRP0 in the later stages of training (steps 100-140).
* The validation scores for both models appear to plateau or slightly decrease towards the end of the training process.
### Interpretation
The chart suggests that both GRP0 and MEL models are learning from the training data, as evidenced by the initial increase in validation score. However, MEL appears to be more stable and ultimately achieves better performance on the AIME24 benchmark. The oscillations in GRP0's validation score could indicate instability during training or sensitivity to specific training batches. The plateauing of both models towards the end of training suggests that further training may not yield significant improvements, or that the models are approaching their maximum performance on this benchmark. The difference in performance between the two models could be due to differences in their architectures, hyperparameters, or training procedures. Further investigation would be needed to determine the root cause of these differences.