## Grouped Bar Chart: Throughput Comparison of SGLang vs. LLM-42
### Overview
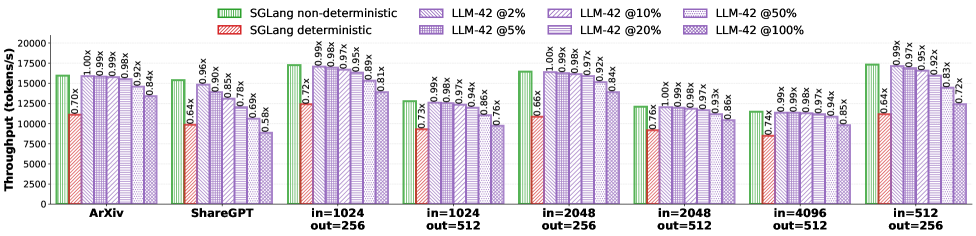
This chart displays a comparative analysis of throughput (measured in tokens/s) across eight different workload configurations. It compares "SGLang" (in both non-deterministic and deterministic modes) against "LLM-42" operating at six different sampling percentages (2%, 5%, 10%, 20%, 50%, and 100%). The chart uses a baseline of "SGLang non-deterministic" for each category, with other bars labeled with a multiplier indicating their relative throughput compared to that baseline.
### Components/Axes
* **Y-Axis:** "Throughput (tokens/s)", ranging from 0 to 20,000 in increments of 2,500.
* **X-Axis:** Eight workload categories:
1. ArXiv
2. ShareGPT
3. in=1024 / out=256
4. in=1024 / out=512
5. in=2048 / out=256
6. in=2048 / out=512
7. in=4096 / out=512
8. in=512 / out=256
* **Legend (Top Center):**
* **Green (Vertical Stripes):** SGLang non-deterministic (Baseline)
* **Red (Diagonal Stripes):** SGLang deterministic
* **Purple (Various Patterns):** LLM-42 @ 2%, 5%, 10%, 20%, 50%, 100% (ordered from lightest/least dense pattern to darkest/most dense pattern).
### Detailed Analysis
The following data points are estimated based on the Y-axis scale. Multipliers are transcribed directly from the labels above each bar.
| Workload Category | SGLang Non-Det (Est. Tokens/s) | SGLang Det (Est. Tokens/s) | LLM-42 @ 2% | LLM-42 @ 5% | LLM-42 @ 10% | LLM-42 @ 20% | LLM-42 @ 50% | LLM-42 @ 100% |
| :--- | :--- | :--- | :--- | :--- | :--- | :--- | :--- | :--- |
| **ArXiv** | ~16,000 | ~11,200 (0.70x) | ~16,000 (1.00x) | ~15,800 (0.99x) | ~15,800 (0.99x) | ~15,700 (0.98x) | ~14,700 (0.92x) | ~13,400 (0.84x) |
| **ShareGPT** | ~15,500 | ~10,000 (0.64x) | ~14,800 (0.96x) | ~14,000 (0.90x) | ~13,200 (0.85x) | ~12,000 (0.78x) | ~10,700 (0.69x) | ~9,000 (0.58x) |
| **in=1024/out=256** | ~17,300 | ~12,500 (0.72x) | ~17,200 (0.99x) | ~17,000 (0.98x) | ~16,800 (0.97x) | ~16,500 (0.95x) | ~15,500 (0.89x) | ~14,000 (0.81x) |
| **in=1024/out=512** | ~12,800 | ~9,400 (0.73x) | ~12,700 (0.99x) | ~12,600 (0.99x) | ~12,500 (0.98x) | ~12,400 (0.97x) | ~12,000 (0.94x) | ~9,700 (0.76x) |
| **in=2048/out=256** | ~16,500 | ~10,900 (0.66x) | ~16,500 (1.00x) | ~16,300 (0.99x) | ~16,200 (0.98x) | ~16,000 (0.97x) | ~15,200 (0.92x) | ~13,800 (0.84x) |
| **in=2048/out=512** | ~12,200 | ~9,300 (0.76x) | ~12,200 (1.00x) | ~12,100 (0.99x) | ~12,000 (0.98x) | ~11,900 (0.97x) | ~11,400 (0.93x) | ~10,500 (0.86x) |
| **in=4096/out=512** | ~11,500 | ~8,500 (0.74x) | ~11,400 (0.99x) | ~11,400 (0.99x) | ~11,300 (0.98x) | ~11,200 (0.97x) | ~10,800 (0.94x) | ~9,800 (0.85x) |
| **in=512/out=256** | ~17,400 | ~11,200 (0.64x) | ~17,200 (0.99x) | ~16,900 (0.97x) | ~16,600 (0.95x) | ~16,000 (0.92x) | ~14,500 (0.83x) | ~12,500 (0.72x) |
### Key Observations
* **Baseline Dominance:** The "SGLang non-deterministic" (green) bar is consistently the highest throughput across all categories.
* **Deterministic Penalty:** The "SGLang deterministic" (red) bar consistently shows the lowest throughput, with multipliers ranging from 0.64x to 0.76x relative to the non-deterministic baseline.
* **LLM-42 Scaling:** Within the LLM-42 series, throughput consistently decreases as the percentage increases (from 2% to 100%).
* **Performance Convergence:** LLM-42 @ 2% performs nearly identically to the SGLang non-deterministic baseline, with multipliers consistently at 0.99x or 1.00x.
### Interpretation
The data suggests that SGLang non-deterministic mode is the most performant configuration for these workloads. The "deterministic" mode imposes a significant performance cost, likely due to the overhead required to ensure consistent outputs.
The LLM-42 series demonstrates a clear trade-off: lower percentages (e.g., 2%) allow the system to maintain throughput levels very close to the non-deterministic baseline, whereas higher percentages (e.g., 100%) result in a noticeable degradation in throughput. This implies that the "percentage" parameter in LLM-42 is a tunable knob for performance, where lower values are more efficient, likely because they involve less computation or fewer constraints than higher values.