## Bar Chart: Throughput Comparison Across Models and Configurations
### Overview
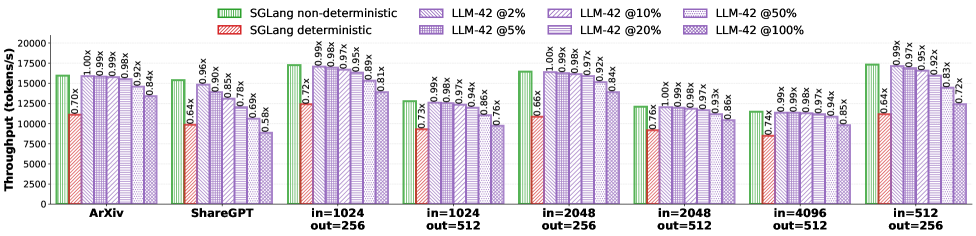
The chart compares the throughput (tokens per second) of different computational models and configurations. It evaluates SGLang (non-deterministic and deterministic) and LLM-42 at varying percentages (2%, 5%, 10%, 20%, 50%, 100%) across multiple datasets (e.g., ArXiv, ShareGPT, and input/output size combinations like in=1024 out=256).
### Components/Axes
- **X-axis**: Models and configurations (e.g., "ArXiv", "ShareGPT", "in=1024 out=256", "in=1024 out=512", etc.).
- **Y-axis**: Throughput (tokens/s), ranging from 0 to 20,000.
- **Legend**:
- **Green**: SGLang non-deterministic.
- **Red**: SGLang deterministic.
- **Purple**: LLM-42 at different percentages (2%, 5%, 10%, 20%, 50%, 100%).
- **Bar Colors**:
- Green bars represent SGLang non-deterministic.
- Red bars represent SGLang deterministic.
- Purple bars represent LLM-42 at specific percentages, with labels (e.g., "LLM-42 @2%") on top of each bar.
### Detailed Analysis
- **SGLang Non-Deterministic (Green)**:
- Throughput values range from ~12,000 to ~18,000 tokens/s across models.
- Highest throughput observed in "in=512 out=256" (~18,000 tokens/s).
- Lowest throughput in "in=4096 out=512" (~12,000 tokens/s).
- **SGLang Deterministic (Red)**:
- Throughput values range from ~7,000 to ~12,000 tokens/s.
- Highest throughput in "in=512 out=256" (~12,000 tokens/s).
- Lowest throughput in "in=4096 out=512" (~7,000 tokens/s).
- **LLM-42 at Different Percentages (Purple)**:
- Throughput decreases as the percentage increases.
- Example: For "in=1024 out=256", LLM-42 @2% (~17,000 tokens/s) vs. @100% (~10,000 tokens/s).
- Highest throughput at 2% (e.g., ~17,000 tokens/s for "in=1024 out=256").
- Lowest throughput at 100% (e.g., ~10,000 tokens/s for "in=1024 out=256").
### Key Observations
1. **SGLang Non-Deterministic vs. Deterministic**:
- Non-deterministic configurations consistently outperform deterministic ones (e.g., ~18,000 vs. ~12,000 tokens/s for "in=512 out=256").
- Deterministic throughput is ~30–40% lower than non-deterministic.
2. **LLM-42 Performance**:
- Throughput drops significantly with higher percentages (e.g., ~17,000 tokens/s at 2% vs. ~10,000 at 100%).
- The 2% and 5% configurations show the highest throughput, while 50% and 100% are the lowest.
3. **Model-Specific Trends**:
- "in=512 out=256" and "in=1024 out=256" configurations generally have the highest throughput.
- Larger input sizes (e.g., "in=4096 out=512") result in lower throughput across all configurations.
### Interpretation
- **Determinism vs. Performance**: The non-deterministic SGLang configuration achieves higher throughput, suggesting that determinism introduces computational overhead.
- **LLM-42 Scalability**: The percentage-based throttling (e.g., 2% vs. 100%) directly impacts performance, with lower percentages enabling higher throughput. This implies that LLM-42’s efficiency is sensitive to resource allocation.
- **Model-Specific Optimization**: Configurations with smaller input/output sizes (e.g., "in=512 out=256") are more efficient, highlighting the importance of balancing input/output dimensions for optimal performance.
### Spatial Grounding
- **Legend**: Positioned at the top of the chart, with colors matching the bars (green, red, purple).
- **Bar Placement**: Each model group (e.g., "ArXiv") has three bars (green, red, purple) aligned vertically. Purple bars are further subdivided by percentage labels.
- **Axis Labels**: Y-axis ("Throughput (tokens/s)") is on the left, X-axis labels are centered below the bars.
### Content Details
- **Numerical Values**:
- SGLang non-deterministic: ~12,000–18,000 tokens/s.
- SGLang deterministic: ~7,000–12,000 tokens/s.
- LLM-42: ~10,000–17,000 tokens/s (depending on percentage).
- **Percentage Labels**: Each purple bar has a label (e.g., "LLM-42 @2%") indicating the configuration.
### Notable Outliers
- **LLM-42 @100%**: Consistently the lowest throughput across all models (e.g., ~10,000 tokens/s for "in=1024 out=256").
- **SGLang Deterministic in=4096 out=512**: Lowest throughput (~7,000 tokens/s), indicating significant performance degradation with large input sizes.
This chart demonstrates the trade-offs between determinism, resource allocation, and model efficiency, with SGLang non-deterministic and LLM-42 at low percentages achieving the highest throughput.