## Scatter Plot: Execution Time to Achieve a Target Item-F1
### Overview
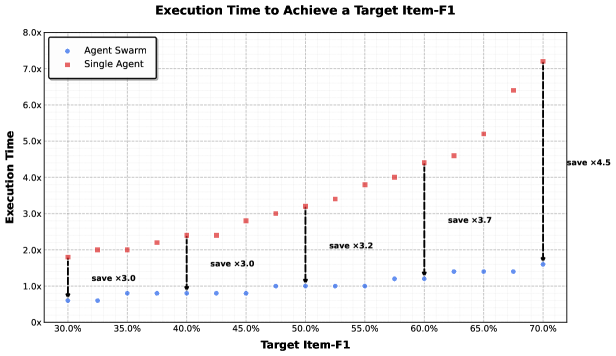
The image is a scatter plot comparing the execution time of an "Agent Swarm" versus a "Single Agent" to achieve a target item F1 score. The x-axis represents the target item F1 score, ranging from 30.0% to 70.0%. The y-axis represents the execution time, scaled in multiples (x), ranging from 0x to 8.0x. The plot shows that the "Agent Swarm" consistently achieves the target item F1 score with a significantly lower execution time compared to the "Single Agent". The plot also includes annotations indicating the execution time savings achieved by the "Agent Swarm" at various target item F1 scores.
### Components/Axes
* **Title:** Execution Time to Achieve a Target Item-F1
* **X-axis:** Target Item-F1
* Scale: 30.0%, 35.0%, 40.0%, 45.0%, 50.0%, 55.0%, 60.0%, 65.0%, 70.0%
* **Y-axis:** Execution Time
* Scale: 0x, 1.0x, 2.0x, 3.0x, 4.0x, 5.0x, 6.0x, 7.0x, 8.0x
* **Legend:** Located in the top-left corner.
* Blue circle: Agent Swarm
* Red square: Single Agent
### Detailed Analysis
* **Agent Swarm (Blue Circles):**
* Trend: The execution time for the Agent Swarm remains relatively constant and low across all target item F1 scores.
* Data Points:
* At 30.0% Target Item-F1, Execution Time ≈ 0.7x
* At 35.0% Target Item-F1, Execution Time ≈ 0.8x
* At 40.0% Target Item-F1, Execution Time ≈ 0.8x
* At 45.0% Target Item-F1, Execution Time ≈ 0.8x
* At 50.0% Target Item-F1, Execution Time ≈ 1.1x
* At 55.0% Target Item-F1, Execution Time ≈ 1.2x
* At 60.0% Target Item-F1, Execution Time ≈ 1.4x
* At 65.0% Target Item-F1, Execution Time ≈ 1.4x
* At 70.0% Target Item-F1, Execution Time ≈ 1.7x
* **Single Agent (Red Squares):**
* Trend: The execution time for the Single Agent increases as the target item F1 score increases.
* Data Points:
* At 30.0% Target Item-F1, Execution Time ≈ 1.8x
* At 35.0% Target Item-F1, Execution Time ≈ 2.0x
* At 40.0% Target Item-F1, Execution Time ≈ 2.4x
* At 45.0% Target Item-F1, Execution Time ≈ 2.8x
* At 50.0% Target Item-F1, Execution Time ≈ 3.1x
* At 55.0% Target Item-F1, Execution Time ≈ 3.8x
* At 60.0% Target Item-F1, Execution Time ≈ 4.5x
* At 65.0% Target Item-F1, Execution Time ≈ 5.2x
* At 70.0% Target Item-F1, Execution Time ≈ 7.2x
* **Savings Annotations:**
* At 30.0% Target Item-F1, save x3.0
* At 40.0% Target Item-F1, save x3.0
* At 50.0% Target Item-F1, save x3.2
* At 60.0% Target Item-F1, save x3.7
* At 70.0% Target Item-F1, save x4.5
### Key Observations
* The "Agent Swarm" consistently outperforms the "Single Agent" in terms of execution time across all target item F1 scores.
* The execution time for the "Single Agent" increases significantly as the target item F1 score increases, while the "Agent Swarm" maintains a relatively stable and low execution time.
* The savings in execution time achieved by the "Agent Swarm" increase as the target item F1 score increases.
### Interpretation
The data suggests that using an "Agent Swarm" is significantly more efficient than using a "Single Agent" for achieving target item F1 scores, especially as the target score increases. The "Agent Swarm" likely benefits from parallel processing or distributed problem-solving, allowing it to maintain a low execution time even as the complexity of the task increases. The "Single Agent", on the other hand, struggles to scale efficiently, resulting in a rapidly increasing execution time. The savings annotations highlight the practical benefits of using the "Agent Swarm" in terms of reduced computational resources and faster task completion.