## Scatter Plot: Execution Time to Achieve a Target Item-F1
### Overview
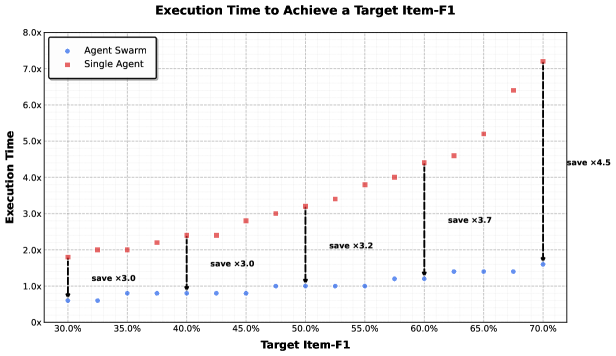
This scatter plot compares the execution time of an "Agent Swarm" versus a "Single Agent" in achieving a target item-F1, across a range of target item-F1 percentages. The x-axis represents the Target Item-F1 percentage, and the y-axis represents the Execution Time, scaled as a multiple of some base unit (denoted as "x"). Vertical lines with "save x[value]" labels are present at several points, potentially indicating save points or checkpoints during the execution.
### Components/Axes
* **Title:** "Execution Time to Achieve a Target Item-F1" (Top-center)
* **X-axis Label:** "Target Item-F1" (Bottom-center). Scale ranges from approximately 30% to 70%, with markers at 30%, 35%, 40%, 45%, 50%, 55%, 60%, 65%, and 70%.
* **Y-axis Label:** "Execution Time" (Left-center). Scale ranges from 0x to 8x, with markers at 0x, 1x, 2x, 3x, 4x, 5x, 6x, 7x, and 8x.
* **Legend:** Located in the top-left corner.
* "Agent Swarm" - Represented by blue circles.
* "Single Agent" - Represented by red crosses.
* **Save Markers:** Vertical black lines with labels "save x[value]" at approximately 30%, 40%, 50%, 55%, 60%, and 70% on the x-axis.
### Detailed Analysis
**Agent Swarm (Blue Circles):**
The Agent Swarm data points generally cluster below the Single Agent data points.
* At 30% Target Item-F1: Approximately 0.7x.
* At 35% Target Item-F1: Approximately 0.8x.
* At 40% Target Item-F1: Approximately 0.9x.
* At 45% Target Item-F1: Approximately 1.0x.
* At 50% Target Item-F1: Approximately 1.1x.
* At 55% Target Item-F1: Approximately 1.2x.
* At 60% Target Item-F1: Approximately 1.1x.
* At 65% Target Item-F1: Approximately 1.2x.
* At 70% Target Item-F1: Approximately 1.3x.
**Single Agent (Red Crosses):**
The Single Agent data points are generally higher in execution time than the Agent Swarm.
* At 30% Target Item-F1: Approximately 1.8x. Labeled "save x3.0".
* At 35% Target Item-F1: Approximately 2.2x.
* At 40% Target Item-F1: Approximately 2.4x. Labeled "save x3.0".
* At 45% Target Item-F1: Approximately 2.8x.
* At 50% Target Item-F1: Approximately 3.0x. Labeled "save x3.0".
* At 55% Target Item-F1: Approximately 3.4x. Labeled "save x3.2".
* At 60% Target Item-F1: Approximately 4.4x. Labeled "save x3.7".
* At 65% Target Item-F1: Approximately 6.4x.
* At 70% Target Item-F1: Approximately 4.5x. Labeled "save x4.5".
### Key Observations
* The Agent Swarm consistently demonstrates lower execution times compared to the Single Agent across all Target Item-F1 percentages.
* The Single Agent's execution time appears to increase more rapidly than the Agent Swarm's as the Target Item-F1 percentage increases, particularly between 60% and 65%.
* The "save" markers suggest periodic saving of the execution state, and the associated "x[value]" indicates the execution time at the point of saving.
* The execution time of the Single Agent at 70% is significantly lower than at 65%, which is an anomaly.
### Interpretation
The data strongly suggests that utilizing an Agent Swarm approach results in significantly faster execution times for achieving the target item-F1 compared to using a Single Agent. This difference becomes more pronounced as the target percentage increases, indicating that the benefits of the swarm approach scale with the complexity of the task. The "save" markers provide insight into the execution process, allowing for potential rollback or resumption from specific points. The anomaly at 70% for the Single Agent could indicate a successful optimization or a different execution path taken at that specific target percentage, or potentially an error in data recording. The consistent lower execution times of the Agent Swarm suggest a more efficient algorithm or parallel processing capability. The plot demonstrates the effectiveness of a distributed approach (Agent Swarm) over a centralized one (Single Agent) in this specific task.