## Scatter Plot: Execution Time to Achieve a Target Item-F1
### Overview
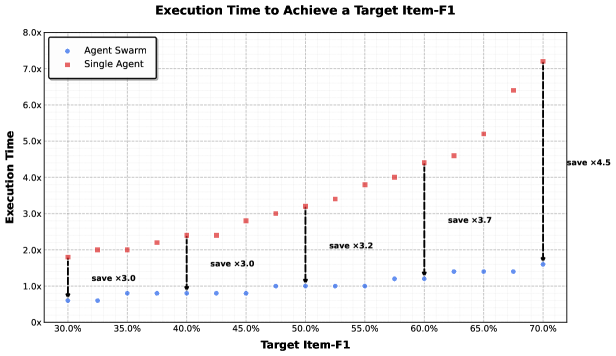
This is a scatter plot comparing the execution time required for two different methods ("Agent Swarm" and "Single Agent") to achieve various target performance levels, measured by "Target Item-F1". The chart demonstrates a significant performance advantage for the "Agent Swarm" method, especially at higher target performance levels.
### Components/Axes
* **Chart Title:** "Execution Time to Achieve a Target Item-F1"
* **X-Axis:** "Target Item-F1". Scale is linear, marked from 30.0% to 70.0% in increments of 5.0%.
* **Y-Axis:** "Execution Time". Scale is linear, marked from 0x to 8.0x in increments of 1.0x. The unit "x" likely represents a multiple of some baseline time.
* **Legend:** Located in the top-left corner of the plot area.
* Blue circle (●): "Agent Swarm"
* Red square (■): "Single Agent"
* **Annotations:** Vertical dashed lines with text annotations ("save x3.0", "save x3.2", etc.) connect specific data points between the two series, highlighting the time savings.
### Detailed Analysis
**Data Series & Trends:**
1. **Single Agent (Red Squares):** The data points show a strong, approximately linear upward trend. As the Target Item-F1 increases, the execution time increases steeply.
* **Trend Verification:** The red squares form a line that slopes sharply upward from left to right.
* **Data Points (Approximate):**
* (30.0%, ~1.8x)
* (32.5%, ~2.0x)
* (35.0%, ~2.0x)
* (37.5%, ~2.1x)
* (40.0%, ~2.4x)
* (42.5%, ~2.4x)
* (45.0%, ~2.8x)
* (47.5%, ~3.0x)
* (50.0%, ~3.2x)
* (52.5%, ~3.4x)
* (55.0%, ~3.8x)
* (57.5%, ~4.0x)
* (60.0%, ~4.4x)
* (62.5%, ~4.6x)
* (65.0%, ~5.2x)
* (67.5%, ~6.4x)
* (70.0%, ~7.2x)
2. **Agent Swarm (Blue Circles):** The data points show a much gentler, slightly upward trend. Execution time increases only modestly as the target performance increases.
* **Trend Verification:** The blue circles form a line that slopes gently upward from left to right.
* **Data Points (Approximate):**
* (30.0%, ~0.6x)
* (32.5%, ~0.6x)
* (35.0%, ~0.8x)
* (37.5%, ~0.8x)
* (40.0%, ~0.8x)
* (42.5%, ~0.8x)
* (45.0%, ~0.8x)
* (47.5%, ~1.0x)
* (50.0%, ~1.0x)
* (52.5%, ~1.0x)
* (55.0%, ~1.0x)
* (57.5%, ~1.2x)
* (60.0%, ~1.2x)
* (62.5%, ~1.4x)
* (65.0%, ~1.4x)
* (67.5%, ~1.4x)
* (70.0%, ~1.6x)
**Annotations (Time Savings):**
The chart explicitly calculates the performance gap at several points:
* At ~30% Target Item-F1: "save x3.0" (Single Agent ~1.8x vs. Agent Swarm ~0.6x)
* At 40% Target Item-F1: "save x3.0" (Single Agent ~2.4x vs. Agent Swarm ~0.8x)
* At 50% Target Item-F1: "save x3.2" (Single Agent ~3.2x vs. Agent Swarm ~1.0x)
* At 60% Target Item-F1: "save x3.7" (Single Agent ~4.4x vs. Agent Swarm ~1.2x)
* At 70% Target Item-F1: "save x4.5" (Single Agent ~7.2x vs. Agent Swarm ~1.6x)
### Key Observations
1. **Diverging Performance:** The performance gap between the two methods widens dramatically as the target difficulty (Target Item-F1) increases. The "save" factor grows from x3.0 to x4.5.
2. **Scalability:** The "Agent Swarm" method exhibits far better scalability. Its execution time grows slowly and sub-linearly with the target, while the "Single Agent" time grows steeply and linearly.
3. **Consistency:** The "Agent Swarm" data points are tightly clustered along a smooth curve, suggesting predictable performance. The "Single Agent" points are also consistent along their steeper trend line.
4. **Outliers:** There are no apparent outliers; all data points follow their respective trends closely.
### Interpretation
This chart provides strong empirical evidence for the superior efficiency of a multi-agent ("Agent Swarm") approach over a single-agent approach for the task of achieving a target Item-F1 score. The "Item-F1" metric is common in information retrieval and natural language processing, suggesting this could be a machine learning or search task.
The key takeaway is not just that the Agent Swarm is faster, but that its **relative advantage increases with the task's difficulty**. Achieving a high-performance target (e.g., 70% F1) is prohibitively expensive in time for a single agent (7.2x baseline), while a swarm can accomplish it in a fraction of that time (1.6x baseline). This suggests that for complex, high-precision tasks, parallelizing the work across multiple agents is a highly effective strategy. The "save" annotations serve as a direct, compelling metric for this advantage, making the chart an effective tool for advocating for the Agent Swarm methodology.