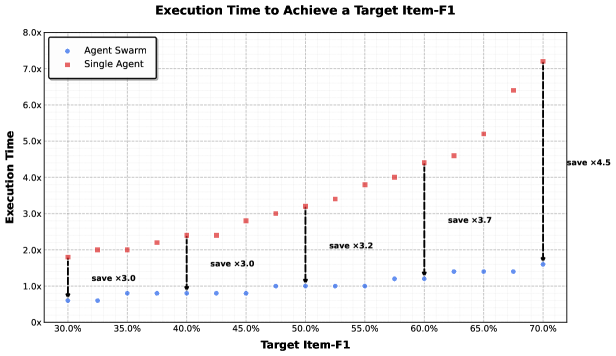
## Line Chart: Execution Time to Achieve a Target Item-F1
### Overview
The chart compares execution time (y-axis) against Target Item-F1 (x-axis) for two approaches: "Agent Swarm" (blue dots) and "Single Agent" (red squares). Execution time is plotted on a logarithmic scale (0x to 8.0x), while Target Item-F1 ranges from 30.0% to 70.0%. Key annotations highlight efficiency savings for the Agent Swarm approach.
### Components/Axes
- **X-axis (Target Item-F1)**:
- Labels: 30.0%, 35.0%, 40.0%, 45.0%, 50.0%, 55.0%, 60.0%, 65.0%, 70.0%
- Scale: Linear increments of 5.0%
- **Y-axis (Execution Time)**:
- Labels: 0x, 1.0x, 2.0x, 3.0x, 4.0x, 5.0x, 6.0x, 7.0x, 8.0x
- Scale: Logarithmic (base 10)
- **Legend**:
- Position: Top-left corner
- Labels:
- Blue dots: "Agent Swarm"
- Red squares: "Single Agent"
- **Annotations**:
- "save x3.0" (multiple points)
- "save x3.2" (near 50.0% Target Item-F1)
- "save x3.7" (near 60.0% Target Item-F1)
- "save x4.5" (near 70.0% Target Item-F1)
### Detailed Analysis
1. **Agent Swarm (Blue Dots)**:
- Execution time remains relatively flat (~0.5x to 1.5x) across all Target Item-F1 values.
- Notable efficiency gains:
- At 30.0%: ~0.5x (save x3.0 vs. Single Agent)
- At 50.0%: ~1.0x (save x3.2)
- At 60.0%: ~1.2x (save x3.7)
- At 70.0%: ~1.6x (save x4.5)
2. **Single Agent (Red Squares)**:
- Execution time increases exponentially with higher Target Item-F1:
- 30.0%: ~1.8x
- 35.0%: ~2.0x
- 40.0%: ~2.4x
- 50.0%: ~3.2x
- 60.0%: ~4.4x
- 70.0%: ~7.2x
3. **Logarithmic Scale Impact**:
- Single Agent's execution time grows non-linearly (e.g., 30.0% to 70.0% increases from 1.8x to 7.2x, a 4x multiplier).
- Agent Swarm's execution time shows minimal growth (~0.5x to 1.6x, a 3.2x multiplier).
### Key Observations
- **Efficiency Gap**: Agent Swarm consistently outperforms Single Agent by factors of 3.0–4.5x.
- **Scalability**: Single Agent's execution time becomes prohibitive at higher Target Item-F1 (e.g., 7.2x at 70.0%).
- **Anomalies**: No outliers; trends are consistent across all data points.
### Interpretation
The chart demonstrates that the Agent Swarm approach drastically reduces execution time compared to Single Agent, with efficiency gains increasing as Target Item-F1 rises. The logarithmic y-axis emphasizes the exponential cost of Single Agent at higher targets (e.g., 7.2x at 70.0% vs. 1.6x for Agent Swarm). The "save x3.0–4.5" annotations quantify the performance advantage, suggesting Agent Swarm is critical for scalability in high-Target Item-F1 scenarios. This aligns with Pareto principles: optimizing for the most impactful 20% (high-Target Item-F1) yields disproportionate benefits.