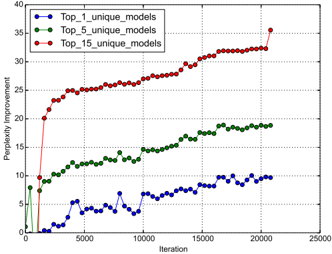
## Line Graph: Perplexity Improvement Across Model Configurations
### Overview
The image depicts a line graph comparing the perplexity improvement of three model configurations (Top_1, Top_5, and Top_15 unique models) over 25,000 iterations. The y-axis measures "Perplexity Improvement" (0–40), while the x-axis tracks "Iteration" (0–25,000). Three data series are plotted: blue (Top_1), green (Top_5), and red (Top_15).
### Components/Axes
- **X-axis (Iteration)**: Labeled "Iteration," ranging from 0 to 25,000 in increments of 5,000.
- **Y-axis (Perplexity Improvement)**: Labeled "Perplexity Improvement," ranging from 0 to 40 in increments of 5.
- **Legend**: Positioned in the top-left corner, with three entries:
- Blue: Top_1_unique_models
- Green: Top_5_unique_models
- Red: Top_15_unique_models
- **Gridlines**: Dotted lines at every 5-unit interval on both axes.
### Detailed Analysis
1. **Top_15_unique_models (Red Line)**:
- **Trend**: Sharp initial increase from ~20 to ~35 between iterations 0–5,000, followed by a plateau near 30–35.
- **Key Points**:
- Iteration 0: ~20
- Iteration 5,000: ~25
- Iteration 10,000: ~27
- Iteration 15,000: ~30
- Iteration 20,000: ~32
- Iteration 25,000: ~35
2. **Top_5_unique_models (Green Line)**:
- **Trend**: Gradual, steady increase from ~5 to ~18 over 25,000 iterations.
- **Key Points**:
- Iteration 0: ~5
- Iteration 5,000: ~10
- Iteration 10,000: ~12
- Iteration 15,000: ~15
- Iteration 20,000: ~17
- Iteration 25,000: ~18
3. **Top_1_unique_models (Blue Line)**:
- **Trend**: Low and fluctuating, peaking at ~10 near iteration 20,000.
- **Key Points**:
- Iteration 0: ~0
- Iteration 5,000: ~3
- Iteration 10,000: ~5
- Iteration 15,000: ~7
- Iteration 20,000: ~10
- Iteration 25,000: ~10
### Key Observations
- **Top_15 models** achieve the highest perplexity improvement, with a rapid early gain followed by stabilization.
- **Top_5 models** show consistent but slower improvement, reaching ~18 by the end.
- **Top_1 models** exhibit minimal improvement (~10) and volatility, suggesting limited effectiveness.
- All lines plateau after ~15,000 iterations, indicating diminishing returns.
### Interpretation
The data suggests that using more unique models (Top_15) yields significantly better perplexity improvement, particularly in early iterations. This implies that model diversity enhances performance initially, but gains taper off as iterations increase. The Top_1 configuration’s poor performance highlights the importance of model variety. The plateauing trends across all configurations suggest that beyond a certain point, additional iterations do not substantially improve results, possibly due to optimization limits or data saturation.