## Line Chart: Perplexity Improvement vs. Iteration
### Overview
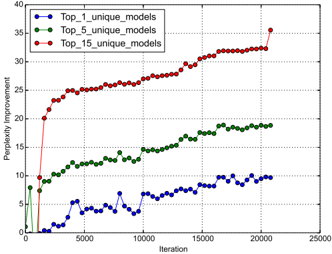
The image is a line chart showing the perplexity improvement versus iteration for three different models: Top_1_unique_models, Top_5_unique_models, and Top_15_unique_models. The chart illustrates how the perplexity improvement changes as the number of iterations increases for each model.
### Components/Axes
* **X-axis:** Iteration, ranging from 0 to 25000.
* **Y-axis:** Perplexity Improvement, ranging from 0 to 40.
* **Legend (top-left):**
* Blue: Top\_1\_unique\_models
* Green: Top\_5\_unique\_models
* Red: Top\_15\_unique\_models
### Detailed Analysis
* **Top\_1\_unique\_models (Blue):**
* The line starts at approximately 0 at iteration 0.
* It increases to approximately 5 by iteration 2500.
* It fluctuates between 3 and 7 until around iteration 12500.
* It then gradually increases to approximately 9 by iteration 20000, where it plateaus.
* **Top\_5\_unique\_models (Green):**
* The line starts at approximately 0 at iteration 0.
* It rapidly increases to approximately 9 by iteration 1000.
* It increases to approximately 13 by iteration 10000.
* It gradually increases to approximately 18 by iteration 17500, where it plateaus.
* **Top\_15\_unique\_models (Red):**
* The line starts at approximately 0 at iteration 0.
* It rapidly increases to approximately 20 by iteration 1000.
* It increases to approximately 25 by iteration 2500.
* It gradually increases to approximately 32 by iteration 17500.
* It increases to approximately 36 by iteration 22500.
### Key Observations
* The Top\_15\_unique\_models consistently shows the highest perplexity improvement across all iterations.
* The Top\_5\_unique\_models shows a moderate perplexity improvement, consistently above Top\_1\_unique\_models.
* The Top\_1\_unique\_models shows the lowest perplexity improvement and exhibits more fluctuation compared to the other two models.
* All three models show a trend of increasing perplexity improvement with increasing iterations, but the rate of improvement decreases as the iterations increase.
### Interpretation
The chart suggests that increasing the number of unique models considered (from Top 1 to Top 15) leads to a higher perplexity improvement. This indicates that considering a larger set of unique models results in better performance. The diminishing rate of improvement with increasing iterations suggests that there is a point of diminishing returns, where further iterations do not significantly improve the perplexity. The fluctuations in the Top\_1\_unique\_models line might indicate instability or sensitivity to specific iterations. Overall, the data demonstrates the impact of model selection and iteration count on perplexity improvement.