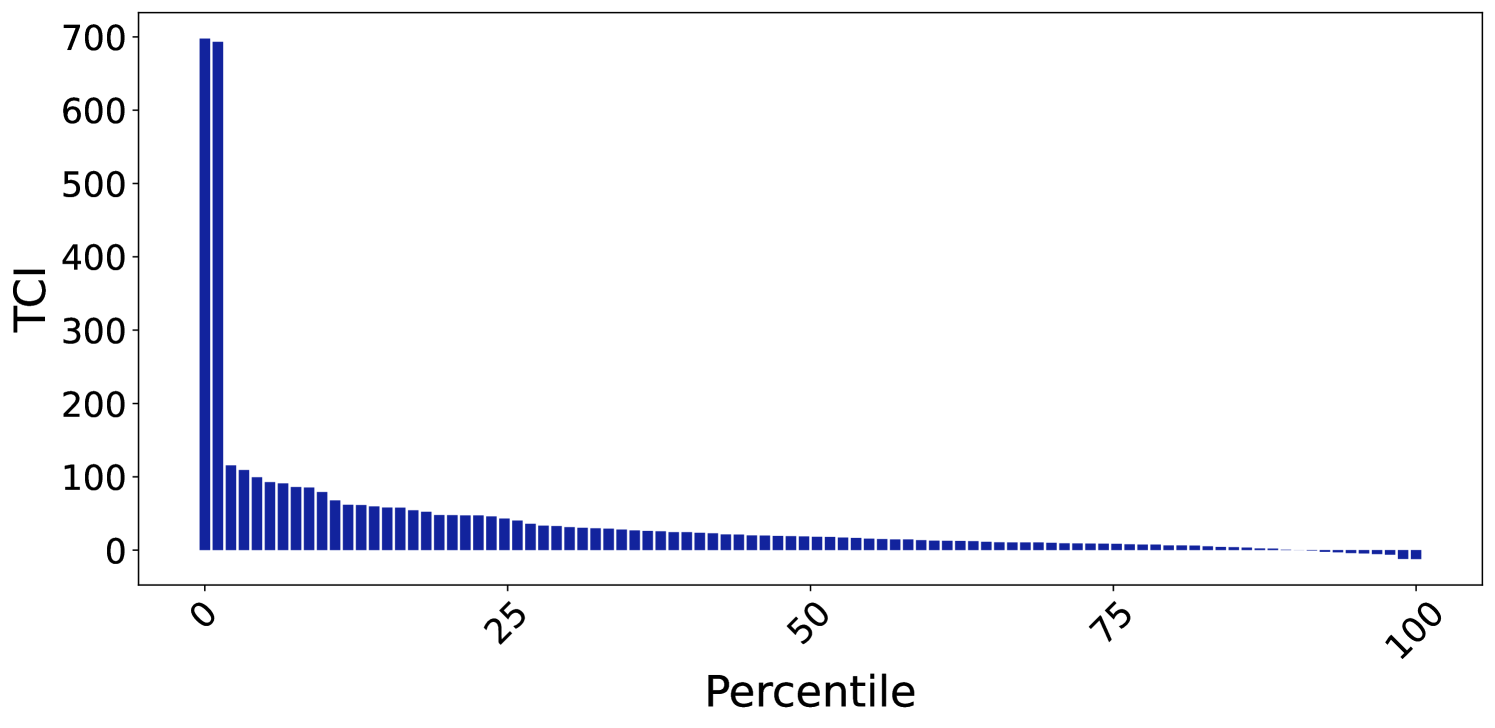
## Bar Chart: TCI Distribution by Percentile
### Overview
The image is a bar chart displaying the distribution of TCI (likely an acronym for a specific metric) across percentiles. The x-axis represents the percentile, ranging from 0 to 100. The y-axis represents the TCI value. The chart shows a steep decline in TCI values from the lower percentiles to the higher percentiles.
### Components/Axes
* **X-axis:** Percentile, ranging from 0 to 100, with labeled markers at 0, 25, 50, 75, and 100.
* **Y-axis:** TCI (likely an acronym), ranging from 0 to 700, with labeled markers at 0, 100, 200, 300, 400, 500, 600, and 700.
* **Bars:** Each bar represents a percentile, with the height of the bar indicating the TCI value for that percentile. All bars are dark blue.
### Detailed Analysis
The TCI values are highest at the lowest percentiles and decrease rapidly as the percentile increases.
* **Percentile 0:** TCI value is approximately 700.
* **Percentile 1:** TCI value is approximately 690.
* **Percentile 5:** TCI value is approximately 120.
* **Percentile 10:** TCI value is approximately 90.
* **Percentile 25:** TCI value is approximately 40.
* **Percentile 50:** TCI value is approximately 20.
* **Percentile 75:** TCI value is approximately 10.
* **Percentile 100:** TCI value is approximately 2.
### Key Observations
* The TCI values are heavily concentrated in the lower percentiles.
* There is a significant drop in TCI values between percentile 0 and percentile 25.
* The TCI values are relatively low and stable for percentiles above 50.
### Interpretation
The chart suggests that the TCI metric is highly skewed towards the lower percentiles. This could indicate that a small percentage of the population or sample contributes to a large portion of the total TCI value. The rapid decline in TCI values as the percentile increases suggests that the majority of the population or sample has relatively low TCI values. This distribution could be indicative of various phenomena depending on what TCI represents, such as income inequality, resource concentration, or performance disparities.