## Bar Charts: Model Performance on MATH and OlympiadBench
### Overview
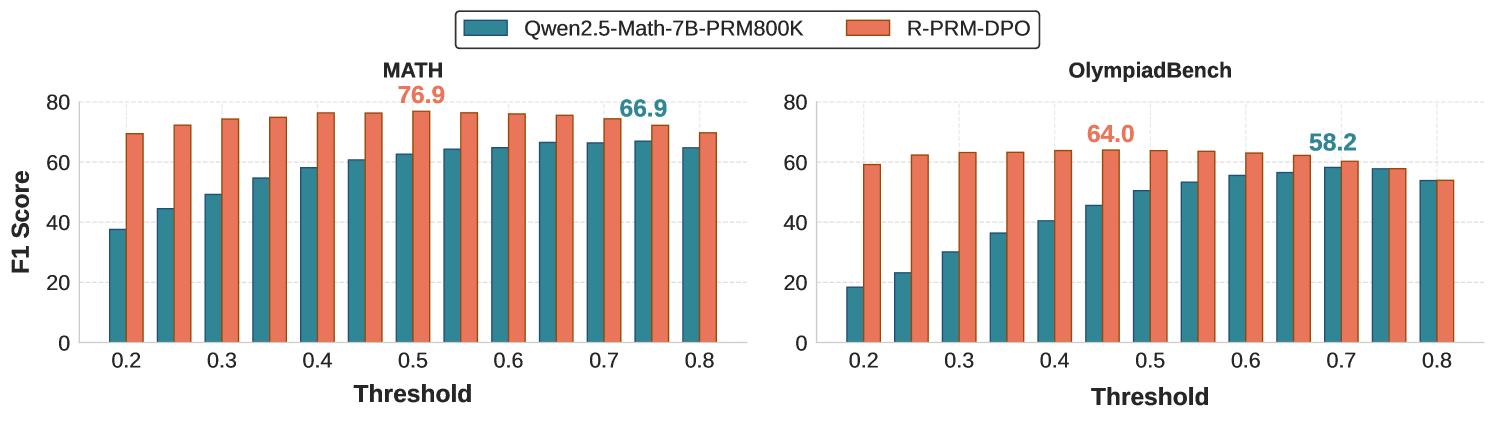
The image contains two bar charts comparing the F1 scores of two models, "Qwen2.5-Math-7B-PRM800K" and "R-PRM-DPO," across different threshold values. The left chart displays results for the "MATH" dataset, while the right chart shows results for the "OlympiadBench" dataset. The x-axis represents the threshold, ranging from 0.2 to 0.8, and the y-axis represents the F1 score, ranging from 0 to 80.
### Components/Axes
* **Title (Left Chart):** MATH
* **Title (Right Chart):** OlympiadBench
* **Y-axis Label:** F1 Score
* **X-axis Label:** Threshold
* **X-axis Markers:** 0.2, 0.3, 0.4, 0.5, 0.6, 0.7, 0.8
* **Y-axis Markers:** 0, 20, 40, 60, 80
* **Legend (Top):**
* Qwen2.5-Math-7B-PRM800K (Teal)
* R-PRM-DPO (Coral)
### Detailed Analysis
**Left Chart (MATH Dataset):**
* **Qwen2.5-Math-7B-PRM800K (Teal):** The F1 score generally increases with the threshold, starting at approximately 38 at 0.2 and reaching approximately 68 at 0.7, then slightly decreasing to approximately 65 at 0.8.
* Threshold 0.2: ~38
* Threshold 0.3: ~49
* Threshold 0.4: ~59
* Threshold 0.5: ~64
* Threshold 0.6: ~66
* Threshold 0.7: ~68
* Threshold 0.8: ~65
* **R-PRM-DPO (Coral):** The F1 score is consistently higher than Qwen2.5-Math-7B-PRM800K across all thresholds. It starts at approximately 70 at 0.2, peaks at 76.9 at 0.5, and then decreases slightly to approximately 67 at 0.8.
* Threshold 0.2: ~70
* Threshold 0.3: ~74
* Threshold 0.4: ~76
* Threshold 0.5: 76.9
* Threshold 0.6: ~77
* Threshold 0.7: 66.9
* Threshold 0.8: ~67
**Right Chart (OlympiadBench Dataset):**
* **Qwen2.5-Math-7B-PRM800K (Teal):** The F1 score increases with the threshold, starting at approximately 18 at 0.2 and reaching approximately 60 at 0.7, then decreasing slightly to approximately 54 at 0.8.
* Threshold 0.2: ~18
* Threshold 0.3: ~30
* Threshold 0.4: ~40
* Threshold 0.5: ~51
* Threshold 0.6: ~57
* Threshold 0.7: ~60
* Threshold 0.8: ~54
* **R-PRM-DPO (Coral):** The F1 score is consistently higher than Qwen2.5-Math-7B-PRM800K across all thresholds. It starts at approximately 60 at 0.2, peaks at 64.0 at 0.5, and then decreases slightly to approximately 58 at 0.8.
* Threshold 0.2: ~60
* Threshold 0.3: ~63
* Threshold 0.4: ~63
* Threshold 0.5: 64.0
* Threshold 0.6: ~64
* Threshold 0.7: 58.2
* Threshold 0.8: ~58
### Key Observations
* R-PRM-DPO consistently outperforms Qwen2.5-Math-7B-PRM800K on both datasets across all thresholds.
* The performance gap between the two models is more significant on the OlympiadBench dataset, especially at lower thresholds.
* For both models and datasets, performance generally increases with the threshold up to a certain point (around 0.5-0.7), after which it plateaus or slightly decreases.
### Interpretation
The data suggests that R-PRM-DPO is a more effective model for both MATH and OlympiadBench datasets compared to Qwen2.5-Math-7B-PRM800K. The threshold value significantly impacts the F1 score, indicating that optimizing the threshold is crucial for maximizing model performance. The fact that performance plateaus or decreases at higher thresholds suggests that there is a trade-off between precision and recall, and a threshold around 0.5-0.7 might be optimal for these models and datasets. The larger performance gap on OlympiadBench indicates that R-PRM-DPO is particularly well-suited for this dataset, possibly due to the nature of the problems or the training data used.