## Bar Chart: F1 Score Comparison on MATH and OlympiadBench
### Overview
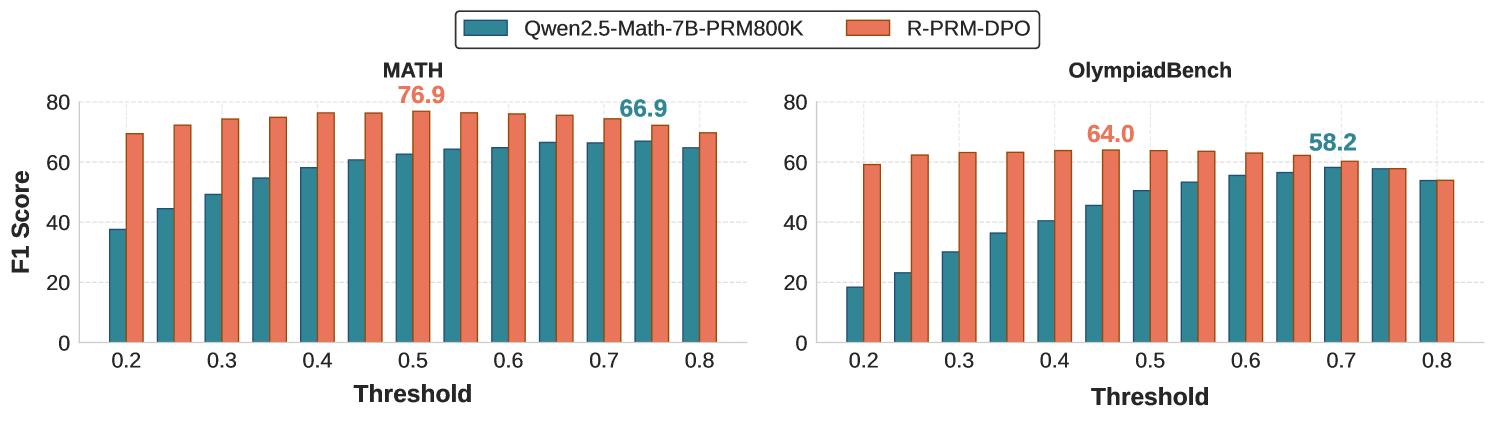
This image displays two grouped bar charts comparing the performance of two models, "Qwen2.5-Math-7B-PRM800K" and "R-PRM-DPO," across two benchmarks: "MATH" and "OlympiadBench." The charts plot the F1 Score against varying confidence thresholds ranging from 0.2 to 0.8.
### Components/Axes
* **Legend (Top Center):**
* **Teal Bar:** Qwen2.5-Math-7B-PRM800K
* **Orange Bar:** R-PRM-DPO
* **Left Chart (MATH):**
* **Y-Axis:** F1 Score (Scale: 0 to 80).
* **X-Axis:** Threshold (Values: 0.2, 0.3, 0.4, 0.5, 0.6, 0.7, 0.8).
* **Right Chart (OlympiadBench):**
* **Y-Axis:** F1 Score (Scale: 0 to 80).
* **X-Axis:** Threshold (Values: 0.2, 0.3, 0.4, 0.5, 0.6, 0.7, 0.8).
### Detailed Analysis
#### Left Chart: MATH
* **Trend:** Both models show an upward trend in F1 score as the threshold increases, though the teal model (Qwen) shows a more consistent, steady climb compared to the orange model (R-PRM-DPO), which plateaus earlier.
* **Data Points (Approximate):**
* **Threshold 0.2:** Teal ~38, Orange ~70
* **Threshold 0.3:** Teal ~45, Orange ~72
* **Threshold 0.4:** Teal ~50, Orange ~74
* **Threshold 0.5:** Teal ~55, Orange ~76 (Annotation: **76.9** above the orange bar)
* **Threshold 0.6:** Teal ~58, Orange ~76
* **Threshold 0.7:** Teal ~61, Orange ~76 (Annotation: **66.9** above the teal bar)
* **Threshold 0.8:** Teal ~65, Orange ~70
#### Right Chart: OlympiadBench
* **Trend:** The teal model (Qwen) shows a very steep upward trend as the threshold increases, indicating that its performance is highly sensitive to confidence filtering. The orange model (R-PRM-DPO) starts high and remains relatively stable across the threshold range.
* **Data Points (Approximate):**
* **Threshold 0.2:** Teal ~18, Orange ~59
* **Threshold 0.3:** Teal ~24, Orange ~62
* **Threshold 0.4:** Teal ~30, Orange ~63
* **Threshold 0.5:** Teal ~37, Orange ~64 (Annotation: **64.0** above the orange bar)
* **Threshold 0.6:** Teal ~41, Orange ~64
* **Threshold 0.7:** Teal ~46, Orange ~64 (Annotation: **58.2** above the teal bar)
* **Threshold 0.8:** Teal ~51, Orange ~58
### Key Observations
* **Performance Gap:** The R-PRM-DPO model (orange) consistently outperforms the Qwen2.5-Math-7B-PRM800K model (teal) across all thresholds in both benchmarks.
* **Sensitivity to Threshold:** The Qwen model shows a much steeper performance gain as the threshold increases, particularly in the OlympiadBench dataset. This suggests that the Qwen model produces many low-confidence, incorrect answers that are filtered out at higher thresholds, whereas the R-PRM-DPO model is more calibrated or accurate even at lower confidence levels.
* **Peak Performance:** The R-PRM-DPO model reaches its peak performance earlier (around 0.5–0.6 threshold) and maintains it, whereas the Qwen model continues to improve as the threshold increases.
### Interpretation
The data demonstrates that "R-PRM-DPO" is a significantly more robust model for these mathematical benchmarks than "Qwen2.5-Math-7B-PRM800K."
The "Threshold" likely represents a confidence filter applied to the model's outputs. The fact that the Qwen model's F1 score rises sharply as the threshold increases suggests that its "low confidence" predictions are frequently incorrect. Conversely, the R-PRM-DPO model maintains a high F1 score even at low thresholds, indicating that its confidence scores are better aligned with its actual accuracy. The performance gap is notably wider in the more difficult "OlympiadBench" dataset, suggesting that R-PRM-DPO handles complex reasoning tasks with higher reliability than the Qwen baseline.