TECHNICAL ASSET FINGERPRINT
21c242e2b5977ab94d613998
Click to view fullscreen
Press ESC or click to close
FOUND IN PAPERS
EXPERT: gemini-3.1-pro-preview VERSION 1
RUNTIME: gemini/gemini-3.1-pro-preview
INTEL_VERIFIED
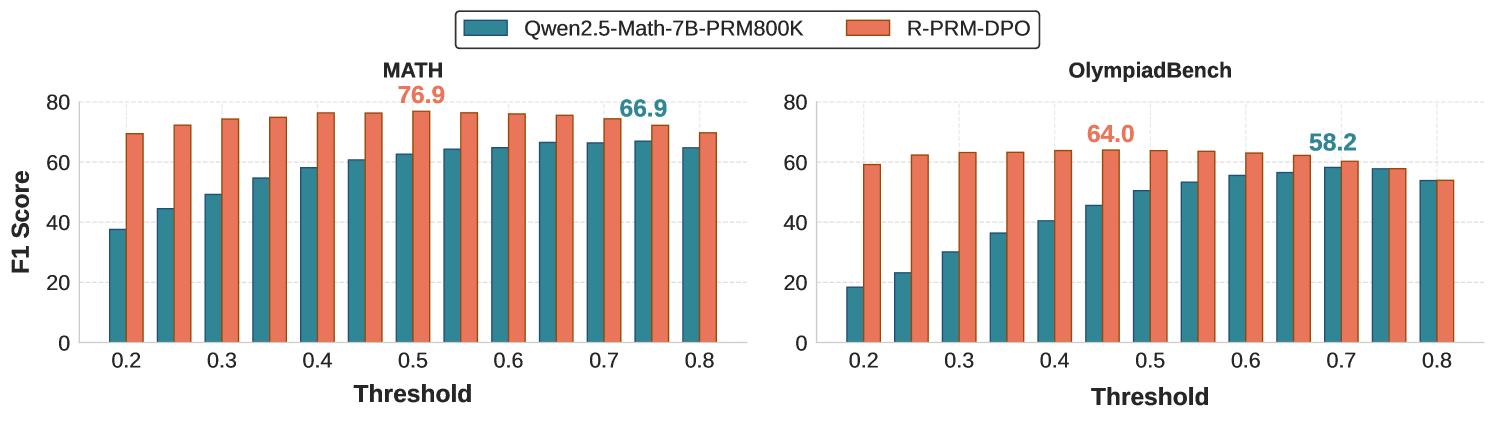
## Dual Bar Charts: Model F1 Score vs. Threshold on MATH and OlympiadBench Datasets
### Overview
The image consists of two side-by-side grouped bar charts comparing the performance (measured by F1 Score) of two different models across varying threshold levels. The left chart displays results for the "MATH" dataset, while the right chart displays results for the "OlympiadBench" dataset. A single, shared legend is positioned at the top center of the image.
### Components/Axes
**Header / Legend (Top Center):**
* **Teal (Blue-Green) Square:** Labeled `Qwen2.5-Math-7B-PRM800K`
* **Orange (Coral) Square:** Labeled `R-PRM-DPO`
**Left Chart: MATH**
* **Title:** `MATH` (Centered above the chart)
* **Y-Axis:** Labeled `F1 Score` (Rotated 90 degrees, positioned on the far left). Scale ranges from 0 to 80, with major tick marks and horizontal dashed gridlines at 0, 20, 40, 60, and 80.
* **X-Axis:** Labeled `Threshold` (Centered below the axis). Major labeled tick marks are at 0.2, 0.3, 0.4, 0.5, 0.6, 0.7, and 0.8. There are unlabelled minor tick marks halfway between each major tick, indicating increments of 0.05 (e.g., 0.25, 0.35).
* **Data Annotations:** Two specific data points are explicitly labeled with text above their respective bars:
* `76.9` (in Orange text) above the Orange bar at Threshold 0.5.
* `66.9` (in Teal text) above the Teal bar at Threshold 0.75.
**Right Chart: OlympiadBench**
* **Title:** `OlympiadBench` (Centered above the chart)
* **Y-Axis:** Shares the same visual scale and gridlines as the left chart (0 to 80 in increments of 20), though the label "F1 Score" is not repeated.
* **X-Axis:** Labeled `Threshold` (Centered below the axis). Identical scale to the left chart: 0.2 to 0.8 with 0.05 increments.
* **Data Annotations:** Two specific data points are explicitly labeled with text above their respective bars:
* `64.0` (in Orange text) above the Orange bar at Threshold 0.45.
* `58.2` (in Teal text) above the Teal bar at Threshold 0.7.
---
### Detailed Analysis
#### 1. MATH Dataset (Left Chart)
**Trend Verification:**
* **Teal (Qwen2.5-Math-7B-PRM800K):** The trend slopes upward steadily from a low starting point at 0.2, peaking late at 0.75, before slightly dropping at 0.8.
* **Orange (R-PRM-DPO):** The trend starts high, forms a gentle convex curve peaking in the middle at 0.5, and slowly declines toward 0.8. Orange consistently outperforms Teal across all thresholds.
**Extracted Data Points (F1 Score vs. Threshold):**
*(Note: Values without explicit labels are visually approximated based on gridlines)*
* **Threshold 0.20:** Teal ~38 | Orange ~69
* **Threshold 0.25:** Teal ~45 | Orange ~72
* **Threshold 0.30:** Teal ~49 | Orange ~74
* **Threshold 0.35:** Teal ~55 | Orange ~75
* **Threshold 0.40:** Teal ~58 | Orange ~76
* **Threshold 0.45:** Teal ~61 | Orange ~76
* **Threshold 0.50:** Teal ~63 | **Orange 76.9 (Explicit Peak)**
* **Threshold 0.55:** Teal ~64 | Orange ~76
* **Threshold 0.60:** Teal ~65 | Orange ~76
* **Threshold 0.65:** Teal ~66 | Orange ~75
* **Threshold 0.70:** Teal ~66 | Orange ~74
* **Threshold 0.75:** **Teal 66.9 (Explicit Peak)** | Orange ~72
* **Threshold 0.80:** Teal ~65 | Orange ~69
#### 2. OlympiadBench Dataset (Right Chart)
**Trend Verification:**
* **Teal (Qwen2.5-Math-7B-PRM800K):** The trend slopes upward in a near-linear fashion from a very low starting point at 0.2, peaking late at 0.7, and then plateauing/dropping slightly.
* **Orange (R-PRM-DPO):** The trend starts high, rises slightly to a broad plateau between 0.35 and 0.6 (peaking at 0.45), and then declines. Orange significantly outperforms Teal at lower thresholds, but the two models converge and perform identically at thresholds 0.75 and 0.80.
**Extracted Data Points (F1 Score vs. Threshold):**
*(Note: Values without explicit labels are visually approximated based on gridlines)*
* **Threshold 0.20:** Teal ~18 | Orange ~59
* **Threshold 0.25:** Teal ~23 | Orange ~62
* **Threshold 0.30:** Teal ~30 | Orange ~63
* **Threshold 0.35:** Teal ~36 | Orange ~63
* **Threshold 0.40:** Teal ~40 | Orange ~64
* **Threshold 0.45:** Teal ~45 | **Orange 64.0 (Explicit Peak)**
* **Threshold 0.50:** Teal ~50 | Orange ~64
* **Threshold 0.55:** Teal ~53 | Orange ~64
* **Threshold 0.60:** Teal ~55 | Orange ~63
* **Threshold 0.65:** Teal ~56 | Orange ~62
* **Threshold 0.70:** **Teal 58.2 (Explicit Peak)** | Orange ~60
* **Threshold 0.75:** Teal ~58 | Orange ~58 (Convergence)
* **Threshold 0.80:** Teal ~54 | Orange ~54 (Convergence)
---
### Key Observations
1. **Absolute Performance:** Both models achieve higher maximum F1 scores on the MATH dataset compared to the OlympiadBench dataset.
2. **Model Superiority:** The `R-PRM-DPO` model (Orange) demonstrates superior performance over the `Qwen2.5-Math-7B-PRM800K` model (Teal) across almost all tested thresholds on both datasets.
3. **Peak Threshold Discrepancy:**
* `R-PRM-DPO` peaks at lower, mid-range thresholds (0.5 on MATH, 0.45 on OlympiadBench).
* `Qwen2.5-Math-7B-PRM800K` requires much higher thresholds to reach its peak performance (0.75 on MATH, 0.7 on OlympiadBench).
4. **Low-Threshold Robustness:** `R-PRM-DPO` maintains high F1 scores even at the lowest threshold (0.2), whereas the Qwen model's performance collapses at low thresholds (dropping to ~18 on OlympiadBench).
5. **Convergence:** On the OlympiadBench dataset, the performance gap between the two models completely closes at the highest thresholds (0.75 and 0.80), where both models perform equally, albeit sub-optimally compared to their respective peaks.
### Interpretation
The data strongly suggests that the `R-PRM-DPO` training methodology yields a significantly more robust and capable model than the baseline `Qwen2.5-Math-7B-PRM800K`, particularly in its confidence calibration.
Because `R-PRM-DPO` achieves high F1 scores at lower thresholds, it indicates that the model is highly accurate even when its internal confidence (threshold) is relatively low. Conversely, the Qwen model requires a very high threshold to filter out incorrect answers and achieve its peak F1 score, meaning it is likely prone to high-confidence errors (hallucinations) at lower thresholds.
Furthermore, the overall lower scores on the `OlympiadBench` chart compared to the `MATH` chart indicate that OlympiadBench is a fundamentally more difficult dataset for both models. The convergence of the two models at high thresholds on OlympiadBench suggests that when forced to be extremely conservative (threshold $\ge$ 0.75), both models are reduced to answering only the easiest questions, negating the advantages of the `R-PRM-DPO` training.
DECODING INTELLIGENCE...