\n
## Bar Chart: Model Performance Comparison on Math and OlympiadBench
### Overview
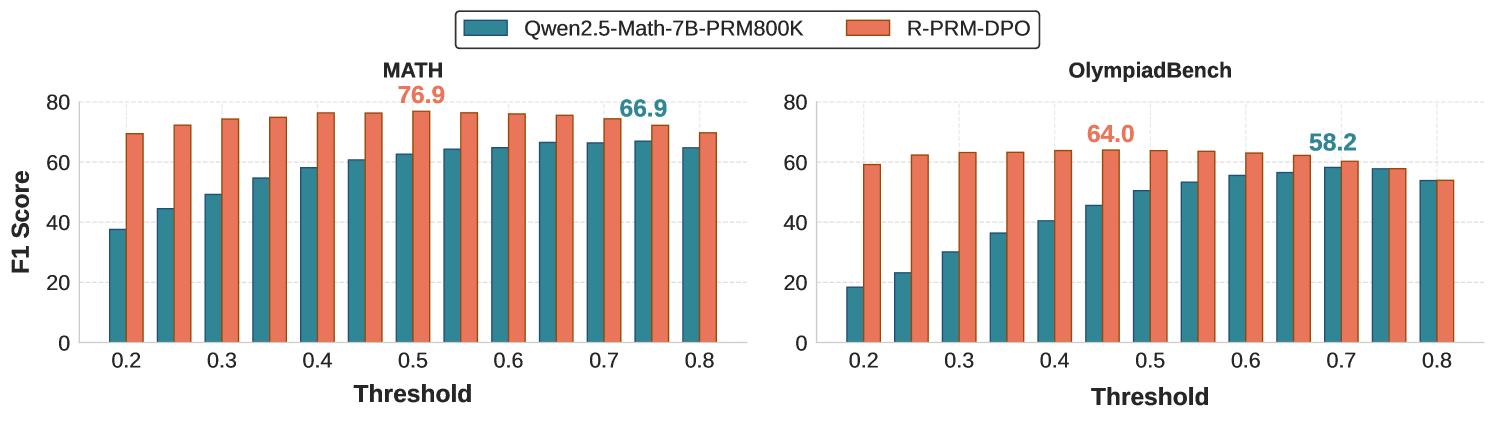
This image presents a comparative bar chart illustrating the performance of two models, "Qwen2.5-Math-7B-PRM800K" and "R-PRM-DPO", across two benchmarks: "MATH" and "OlympiadBench". The performance metric used is F1 Score, plotted against varying Threshold values.
### Components/Axes
* **X-axis:** Threshold, ranging from 0.2 to 0.8, with increments of 0.1.
* **Y-axis:** F1 Score, ranging from 0 to 80.
* **Models (Legend):**
* Qwen2.5-Math-7B-PRM800K (represented by teal/green color)
* R-PRM-DPO (represented by coral/orange color)
* **Benchmarks (Titles):**
* MATH (left chart)
* OlympiadBench (right chart)
* **Data Representation:** Bar charts, with each bar representing the F1 Score for a specific model at a given threshold.
### Detailed Analysis or Content Details
**MATH Benchmark (Left Chart):**
* **Qwen2.5-Math-7B-PRM800K (Teal):**
* 0.2: Approximately 48.0
* 0.3: Approximately 58.0
* 0.4: Approximately 64.0
* 0.5: Approximately 76.9
* 0.6: Approximately 72.0
* 0.7: Approximately 68.0
* 0.8: Approximately 66.9
* *Trend:* The F1 score increases sharply from 0.2 to 0.5, then plateaus and slightly decreases from 0.5 to 0.8.
* **R-PRM-DPO (Coral):**
* 0.2: Approximately 16.0
* 0.3: Approximately 32.0
* 0.4: Approximately 48.0
* 0.5: Approximately 64.0
* 0.6: Approximately 72.0
* 0.7: Approximately 74.0
* 0.8: Approximately 70.0
* *Trend:* The F1 score increases steadily from 0.2 to 0.7, then slightly decreases at 0.8.
**OlympiadBench Benchmark (Right Chart):**
* **Qwen2.5-Math-7B-PRM800K (Teal):**
* 0.2: Approximately 32.0
* 0.3: Approximately 44.0
* 0.4: Approximately 52.0
* 0.5: Approximately 56.0
* 0.6: Approximately 58.2
* 0.7: Approximately 58.0
* 0.8: Approximately 57.0
* *Trend:* The F1 score increases from 0.2 to 0.6, then plateaus and slightly decreases from 0.6 to 0.8.
* **R-PRM-DPO (Coral):**
* 0.2: Approximately 8.0
* 0.3: Approximately 24.0
* 0.4: Approximately 36.0
* 0.5: Approximately 48.0
* 0.6: Approximately 60.0
* 0.7: Approximately 62.0
* 0.8: Approximately 64.0
* *Trend:* The F1 score increases steadily from 0.2 to 0.8.
### Key Observations
* **MATH Benchmark:** Qwen2.5-Math-7B-PRM800K consistently outperforms R-PRM-DPO across all threshold values. The performance of Qwen2.5-Math-7B-PRM800K peaks at a threshold of 0.5.
* **OlympiadBench Benchmark:** R-PRM-DPO shows a consistent increase in F1 score as the threshold increases, while Qwen2.5-Math-7B-PRM800K plateaus after a threshold of 0.6.
* The difference in performance between the two models is more pronounced in the MATH benchmark than in the OlympiadBench benchmark.
### Interpretation
The data suggests that Qwen2.5-Math-7B-PRM800K is better suited for the MATH benchmark, particularly at a threshold of 0.5, while R-PRM-DPO demonstrates more consistent performance gains with increasing thresholds on the OlympiadBench benchmark. The varying performance across benchmarks indicates that the models have different strengths and weaknesses depending on the type of mathematical problem. The plateauing of Qwen2.5-Math-7B-PRM800K on OlympiadBench suggests that increasing the threshold beyond a certain point does not yield significant improvements in performance. The consistent improvement of R-PRM-DPO on OlympiadBench suggests that it may benefit from more stringent thresholding. The choice of model and threshold should be tailored to the specific application and desired balance between precision and recall.