\n
## Comparative Bar Chart: Model Performance on MATH and OlympiadBench Datasets
### Overview
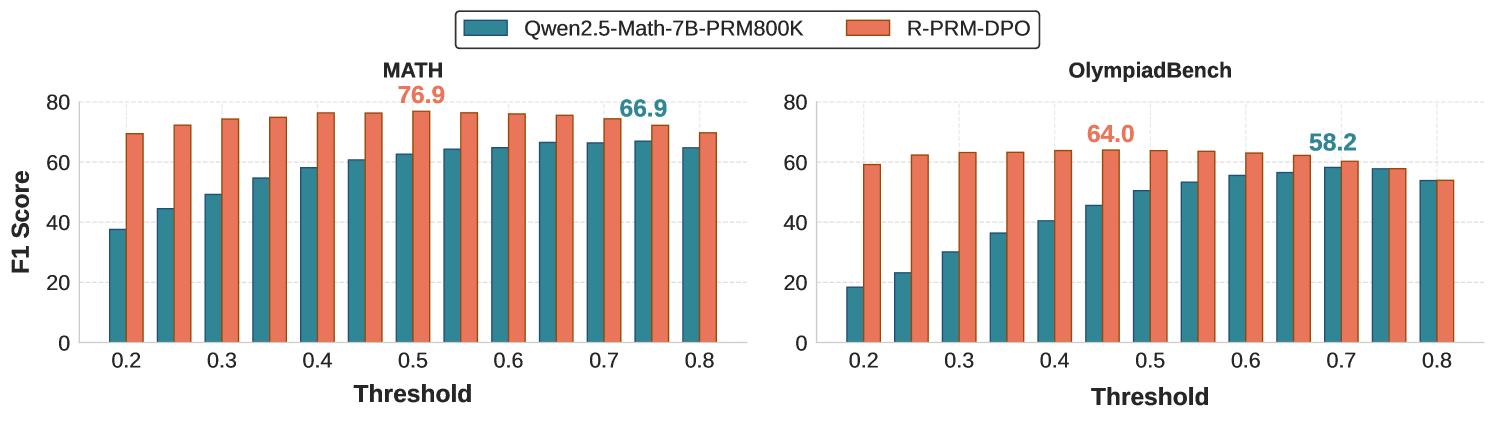
The image displays two side-by-side bar charts comparing the F1 Score performance of two AI models, **Qwen2.5-Math-7B-PRM800K** and **R-PRM-DPO**, across varying threshold values on two distinct benchmark datasets: **MATH** and **OlympiadBench**.
### Components/Axes
* **Chart Type:** Grouped Bar Chart (two subplots).
* **Legend:** Located at the top center of the entire figure.
* **Teal Bar:** Qwen2.5-Math-7B-PRM800K
* **Coral Bar:** R-PRM-DPO
* **Y-Axis (Both Subplots):** Labeled "F1 Score". Scale ranges from 0 to 80, with major gridlines at intervals of 20.
* **X-Axis (Both Subplots):** Labeled "Threshold". Discrete values marked: 0.2, 0.3, 0.4, 0.5, 0.6, 0.7, 0.8.
* **Subplot Titles:**
* Left Chart: **MATH**
* Right Chart: **OlympiadBench**
* **Data Annotations:** Specific peak F1 scores are annotated directly on the charts in the color of the corresponding model.
### Detailed Analysis
#### **Left Chart: MATH Dataset**
* **Trend Verification:** Both models show a general upward trend in F1 Score as the threshold increases from 0.2 to approximately 0.5-0.6, after which performance plateaus or slightly declines. The R-PRM-DPO (coral) bars are consistently taller than the Qwen2.5 (teal) bars at every threshold.
* **Data Points (Approximate F1 Scores):**
* **Threshold 0.2:** Qwen2.5 ~38, R-PRM-DPO ~70
* **Threshold 0.3:** Qwen2.5 ~45, R-PRM-DPO ~72
* **Threshold 0.4:** Qwen2.5 ~55, R-PRM-DPO ~75
* **Threshold 0.5:** Qwen2.5 ~60, R-PRM-DPO ~76 (Annotated Peak: **76.9**)
* **Threshold 0.6:** Qwen2.5 ~65, R-PRM-DPO ~76
* **Threshold 0.7:** Qwen2.5 ~67, R-PRM-DPO ~75
* **Threshold 0.8:** Qwen2.5 ~65, R-PRM-DPO ~70
* **Annotated Peak for Qwen2.5:** The highest annotated score for the Qwen2.5 model on MATH is **66.9**, occurring at threshold 0.7.
#### **Right Chart: OlympiadBench Dataset**
* **Trend Verification:** A similar pattern emerges: both models' performance improves with increasing threshold up to a point (around 0.5-0.7) before leveling off. The performance gap between the two models is narrower here than in the MATH chart, but R-PRM-DPO (coral) still maintains a lead at all thresholds.
* **Data Points (Approximate F1 Scores):**
* **Threshold 0.2:** Qwen2.5 ~19, R-PRM-DPO ~59
* **Threshold 0.3:** Qwen2.5 ~23, R-PRM-DPO ~62
* **Threshold 0.4:** Qwen2.5 ~36, R-PRM-DPO ~63
* **Threshold 0.5:** Qwen2.5 ~46, R-PRM-DPO ~64 (Annotated Peak: **64.0**)
* **Threshold 0.6:** Qwen2.5 ~53, R-PRM-DPO ~63
* **Threshold 0.7:** Qwen2.5 ~58, R-PRM-DPO ~62 (Annotated Peak for Qwen2.5: **58.2**)
* **Threshold 0.8:** Qwen2.5 ~54, R-PRM-DPO ~54
### Key Observations
1. **Consistent Superiority:** The R-PRM-DPO model (coral) achieves a higher F1 Score than the Qwen2.5-Math-7B-PRM800K model (teal) at every single threshold value on both the MATH and OlympiadBench datasets.
2. **Optimal Threshold Range:** For both models and both datasets, performance appears to peak in the mid-range thresholds (0.5 to 0.7). Performance is notably lower at the lowest threshold (0.2).
3. **Dataset Difficulty:** The absolute F1 scores are lower on the OlympiadBench dataset for both models compared to the MATH dataset, suggesting OlympiadBench may be a more challenging benchmark.
4. **Performance Gap:** The performance gap between the two models is more pronounced on the MATH dataset (e.g., at threshold 0.5, a ~16.9 point difference) than on the OlympiadBench dataset (e.g., at threshold 0.5, an ~18 point difference, but the relative gap is smaller due to lower overall scores).
### Interpretation
The data demonstrates that the **R-PRM-DPO** model is more effective than the **Qwen2.5-Math-7B-PRM800K** model for the task measured by the F1 Score on these mathematical reasoning benchmarks. The consistent lead across all thresholds suggests a robust architectural or training advantage for R-PRM-DPO.
The trend of performance peaking at mid-range thresholds indicates a potential "sweet spot" for the threshold parameter. Setting the threshold too low (0.2) likely includes too many low-confidence or incorrect predictions, harming precision. Conversely, setting it too high (0.8) may filter out too many correct predictions, harming recall. The optimal balance between precision and recall (which F1 Score captures) is found in the middle.
The lower overall scores on OlympiadBench imply that this benchmark contains problems that are more difficult for these models to solve correctly, or that the evaluation criteria are stricter. The fact that both models follow the same performance curve shape across thresholds on both datasets suggests the underlying behavior of the models in response to the threshold parameter is consistent, even on tasks of varying difficulty.