## Bar Chart: Model Performance Comparison Across Thresholds
### Overview
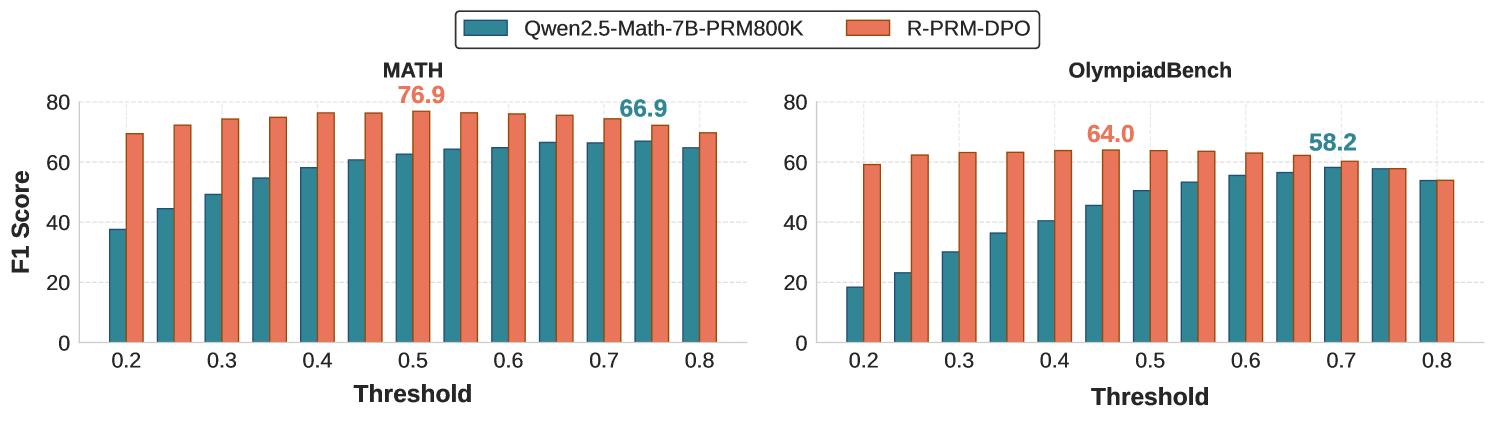
The image contains two side-by-side bar charts comparing the F1 scores of two models ("Qwen2.5-Math-7B-PRM800K" and "R-PRM-DPO") across varying thresholds (0.2–0.8) on two tasks: "MATH" and "OlympiadBench". The charts use blue bars for Qwen2.5-Math-7B-PRM800K and orange bars for R-PRM-DPO.
---
### Components/Axes
- **X-axis (Threshold)**: Labeled "Threshold", with increments of 0.1 (0.2, 0.3, ..., 0.8).
- **Y-axis (F1 Score)**: Labeled "F1 Score", ranging from 0 to 80.
- **Legends**:
- Blue: "Qwen2.5-Math-7B-PRM800K"
- Orange: "R-PRM-DPO"
- **Chart Titles**:
- Left: "MATH"
- Right: "OlympiadBench"
---
### Detailed Analysis
#### MATH Chart
- **Qwen2.5-Math-7B-PRM800K (Blue)**:
- Threshold 0.2: 38.1
- Threshold 0.3: 48.7
- Threshold 0.4: 58.2
- Threshold 0.5: 63.4
- Threshold 0.6: 66.9
- Threshold 0.7: 66.9
- Threshold 0.8: 66.9
- **R-PRM-DPO (Orange)**:
- Threshold 0.2: 70.3
- Threshold 0.3: 73.1
- Threshold 0.4: 76.9
- Threshold 0.5: 76.9
- Threshold 0.6: 76.9
- Threshold 0.7: 76.9
- Threshold 0.8: 73.1
#### OlympiadBench Chart
- **Qwen2.5-Math-7B-PRM800K (Blue)**:
- Threshold 0.2: 18.7
- Threshold 0.3: 27.3
- Threshold 0.4: 40.1
- Threshold 0.5: 48.7
- Threshold 0.6: 54.3
- Threshold 0.7: 58.2
- Threshold 0.8: 54.3
- **R-PRM-DPO (Orange)**:
- Threshold 0.2: 59.8
- Threshold 0.3: 62.4
- Threshold 0.4: 64.0
- Threshold 0.5: 64.0
- Threshold 0.6: 64.0
- Threshold 0.7: 64.0
- Threshold 0.8: 55.1
---
### Key Observations
1. **MATH Task**:
- R-PRM-DPO consistently outperforms Qwen2.5-Math-7B-PRM800K across all thresholds, with a peak F1 score of 76.9 at thresholds 0.4–0.7.
- Qwen2.5-Math-7B-PRM800K shows steady improvement until threshold 0.7, then plateaus.
2. **OlympiadBench Task**:
- R-PRM-DPO starts with a significant advantage (59.8 at threshold 0.2) but declines sharply after threshold 0.5.
- Qwen2.5-Math-7B-PRM800K surpasses R-PRM-DPO at threshold 0.7 (58.2 vs. 64.0) but drops below it at threshold 0.8.
3. **Threshold Sensitivity**:
- Both models exhibit performance declines at higher thresholds (0.7–0.8), suggesting potential overfitting or sensitivity to parameter tuning.
---
### Interpretation
- **Model Strengths**:
- R-PRM-DPO excels in the MATH task, likely due to its architecture or training data alignment with mathematical reasoning.
- Qwen2.5-Math-7B-PRM800K performs better in OlympiadBench at mid-to-high thresholds, indicating adaptability to complex problem-solving patterns.
- **Threshold Trade-offs**:
- Higher thresholds (0.7–0.8) reduce performance for both models, possibly due to overly strict filtering of model outputs.
- R-PRM-DPO’s decline in OlympiadBench after threshold 0.5 suggests it may struggle with nuanced reasoning at stricter settings.
- **Practical Implications**:
- For MATH tasks, R-PRM-DPO is the optimal choice regardless of threshold.
- For OlympiadBench, Qwen2.5-Math-7B-PRM800K may be preferable at thresholds 0.6–0.7, but its performance drops at 0.8.
- **Anomalies**:
- The sharp drop in R-PRM-DPO’s OlympiadBench score at threshold 0.8 (55.1) warrants investigation into model behavior at extreme settings.