## Chart: Shannon and Bayesian Surprises
### Overview
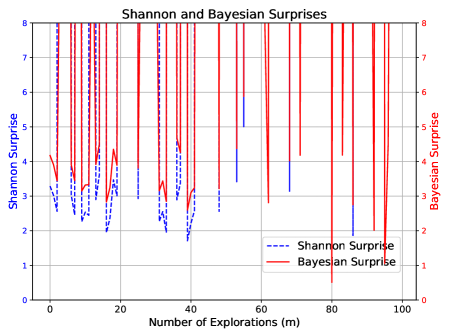
The image is a line chart comparing Shannon Surprise and Bayesian Surprise over a number of explorations. The x-axis represents the number of explorations (m), ranging from 0 to 100. The left y-axis represents Shannon Surprise, and the right y-axis represents Bayesian Surprise, both ranging from 0 to 8. The chart displays two data series: Shannon Surprise (blue dashed line) and Bayesian Surprise (red solid line).
### Components/Axes
* **Title:** Shannon and Bayesian Surprises
* **X-axis:** Number of Explorations (m), with ticks at 0, 20, 40, 60, 80, and 100.
* **Left Y-axis:** Shannon Surprise, with ticks at 0, 1, 2, 3, 4, 5, 6, 7, and 8.
* **Right Y-axis:** Bayesian Surprise, with ticks at 0, 1, 2, 3, 4, 5, 6, 7, and 8.
* **Legend:** Located at the bottom-center of the chart.
* Shannon Surprise: Represented by a blue dashed line.
* Bayesian Surprise: Represented by a red solid line.
### Detailed Analysis
* **Shannon Surprise (Blue Dashed Line):**
* Trend: Initially decreases with fluctuations, then remains relatively low with occasional spikes.
* Values:
* At 0 explorations: approximately 3.5
* At 10 explorations: fluctuates between 2.2 and 3.2
* At 20 explorations: fluctuates between 2.0 and 3.5
* At 30 explorations: fluctuates between 2.0 and 3.0
* At 40 explorations: fluctuates between 1.7 and 3.0
* At 60 explorations: approximately 3.8
* At 80 explorations: approximately 5.8
* At 100 explorations: approximately 8.0
* **Bayesian Surprise (Red Solid Line):**
* Trend: Starts relatively high, drops, and then exhibits frequent spikes reaching the maximum value of 8.
* Values:
* At 0 explorations: approximately 4.0
* At 5 explorations: approximately 3.2
* At 10 explorations: approximately 4.2
* At 15 explorations: approximately 4.5
* At 20 explorations: approximately 3.2
* At 25 explorations: approximately 4.5
* At 30 explorations: approximately 3.2
* At 35 explorations: approximately 4.5
* At 40 explorations: approximately 3.2
* Frequent spikes to 8.0 throughout the exploration range.
### Key Observations
* Bayesian Surprise frequently spikes to its maximum value (8) throughout the exploration range.
* Shannon Surprise generally remains lower than Bayesian Surprise, especially after the initial explorations.
* Both Shannon and Bayesian Surprise exhibit fluctuations, indicating variability in the surprise levels during exploration.
### Interpretation
The chart compares two different measures of "surprise" during a series of explorations. Bayesian Surprise, which is based on a probabilistic model, shows frequent high surprise values, suggesting that the model often encounters unexpected outcomes. Shannon Surprise, which is based on information theory, generally remains lower, indicating a more consistent level of uncertainty or information gain. The fluctuations in both measures suggest that the exploration process involves periods of both predictable and unpredictable events. The data suggests that the Bayesian model is more sensitive to unexpected events than the Shannon measure.