## Line Graph: Shannon and Bayesian Surprises
### Overview
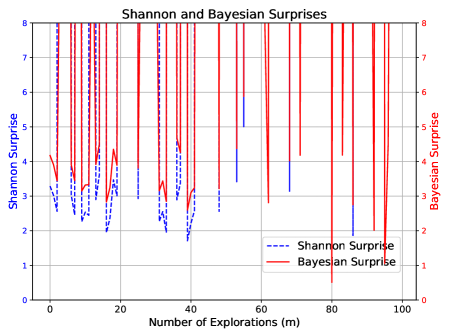
The image is a line graph comparing two metrics, "Shannon Surprise" and "Bayesian Surprise," plotted against the "Number of Explorations (m)" on the x-axis. The graph uses two y-axes: the left for Shannon Surprise (0–8) and the right for Bayesian Surprise (0–5). Two lines are present: a dashed blue line for Shannon Surprise and a solid red line for Bayesian Surprise. The legend is positioned in the bottom-right corner.
### Components/Axes
- **Title**: "Shannon and Bayesian Surprises"
- **X-axis**: "Number of Explorations (m)" with markers at 0, 20, 40, 60, 80, and 100.
- **Y-axes**:
- Left: "Shannon Surprise" (0–8).
- Right: "Bayesian Surprise" (0–5).
- **Legend**: Located in the bottom-right corner, with:
- Dashed blue line: "Shannon Surprise"
- Solid red line: "Bayesian Surprise"
### Detailed Analysis
- **Shannon Surprise (Blue Dashed Line)**:
- Peaks occur at approximately 10, 30, 50, 70, and 90 explorations.
- Maximum value reaches ~8 on the y-axis.
- The line exhibits high variability, with sharp drops and rises between peaks.
- **Bayesian Surprise (Red Solid Line)**:
- Peaks occur at approximately 20, 40, 60, 80, and 100 explorations.
- Maximum value reaches ~5 on the y-axis.
- The line is more consistent, with regular intervals between peaks and less variability.
### Key Observations
1. **Shannon Surprise** shows higher magnitude values (up to 8) compared to Bayesian Surprise (up to 5).
2. **Shannon Surprise** has irregular, frequent peaks, while **Bayesian Surprise** peaks at regular intervals (every 20 explorations).
3. The two lines diverge significantly in both magnitude and pattern, suggesting distinct behaviors in their respective metrics.
### Interpretation
The graph illustrates a comparison between two measures of "surprise" as a function of exploration. The **Shannon Surprise** metric exhibits greater variability and higher peaks, indicating a higher degree of unpredictability or entropy in the system being measured. In contrast, **Bayesian Surprise** shows more structured, periodic peaks, suggesting a model that incorporates prior knowledge or constraints, leading to lower but more predictable outcomes. The divergence in trends implies that the two metrics capture different aspects of uncertainty or information gain, with Shannon emphasizing randomness and Bayesian reflecting a more controlled or probabilistic framework. The x-axis label "Number of Explorations (m)" suggests that the data may relate to iterative processes, such as machine learning or experimental design, where exploration depth influences the observed surprises.