## Line Chart: Area vs. Weight Type for Different Weight Configurations
### Overview
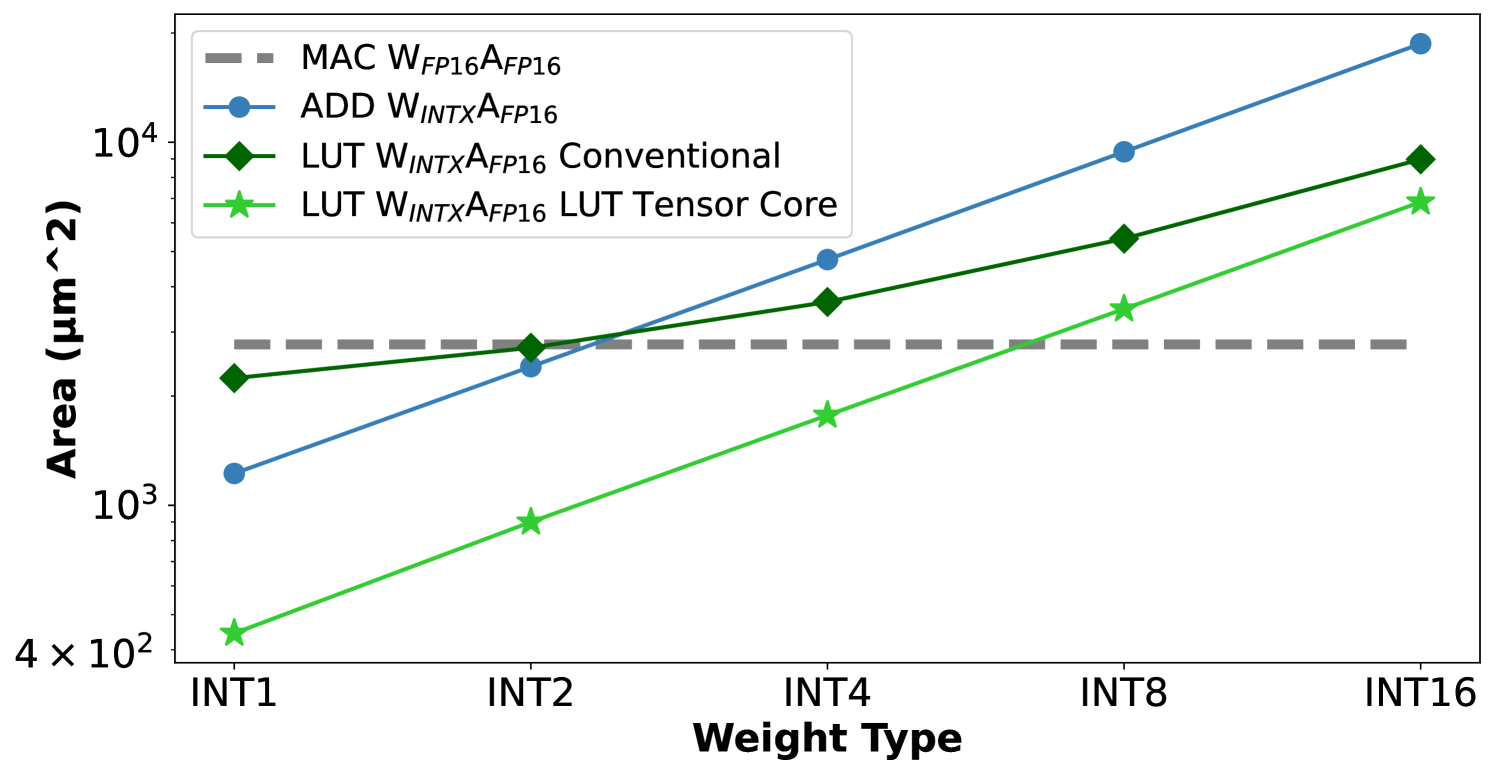
The chart compares the area (in μm²) required for different weight configurations (INT1, INT2, INT4, INT8, INT16) across four weight types: MAC W_FP16A_FP16, ADD W_INTXA_FP16, LUT W_INTXA_FP16 Conventional, and LUT W_INTXA_FP16 LUT Tensor Core. The y-axis uses a logarithmic scale (10³ to 10⁴), while the x-axis lists weight types in increasing order.
---
### Components/Axes
- **X-axis (Weight Type)**: Categories labeled as INT1, INT2, INT4, INT8, INT16 (left to right).
- **Y-axis (Area)**: Logarithmic scale from 4×10² to 10⁴ μm².
- **Legend**: Located in the top-right corner, with four entries:
1. **MAC W_FP16A_FP16**: Dashed gray line.
2. **ADD W_INTXA_FP16**: Solid blue line with circle markers.
3. **LUT W_INTXA_FP16 Conventional**: Solid green line with diamond markers.
4. **LUT W_INTXA_FP16 LUT Tensor Core**: Solid green line with star markers.
---
### Detailed Analysis
1. **MAC W_FP16A_FP16** (Dashed Gray Line):
- Constant area of ~10³ μm² across all weight types.
- No variation observed.
2. **ADD W_INTXA_FP16** (Blue Line with Circles):
- Starts at ~10³ μm² (INT1) and increases linearly to ~10⁴ μm² (INT16).
- Data points:
- INT1: ~10³
- INT2: ~1.5×10³
- INT4: ~3×10³
- INT8: ~7×10³
- INT16: ~10⁴
3. **LUT W_INTXA_FP16 Conventional** (Green Line with Diamonds):
- Starts at ~10³.5 μm² (INT1) and increases to ~10⁴.5 μm² (INT16).
- Data points:
- INT1: ~3×10³
- INT2: ~5×10³
- INT4: ~8×10³
- INT8: ~1.2×10⁴
- INT16: ~3×10⁴
4. **LUT W_INTXA_FP16 LUT Tensor Core** (Green Line with Stars):
- Starts at ~4×10² μm² (INT1) and increases to ~10⁴ μm² (INT16).
- Data points:
- INT1: ~4×10²
- INT2: ~1×10³
- INT4: ~2×10³
- INT8: ~5×10³
- INT16: ~1×10⁴
---
### Key Observations
- **MAC** remains constant, suggesting fixed-area optimization for FP16 precision.
- **ADD** and **Conventional LUT** show parallel growth, but Conventional LUT requires ~2–3× more area than ADD at higher weight types.
- **LUT Tensor Core** starts with significantly lower area (INT1: 4×10² vs. ADD: 10³) but converges with ADD at INT16 (~10⁴ μm²).
- All lines except MAC exhibit exponential growth with increasing weight type.
---
### Interpretation
The data suggests that:
1. **Precision Trade-offs**: MAC’s fixed area implies hardware optimization for FP16 operations, while ADD and LUT configurations scale with weight type complexity.
2. **Efficiency Gains**: The LUT Tensor Core reduces area by ~50% compared to Conventional LUT at INT1 but matches ADD’s area at INT16, indicating diminishing returns at higher precision.
3. **Scalability**: ADD and LUT Tensor Core configurations scale more efficiently than Conventional LUT, which may impact design choices for high-precision applications.
The logarithmic y-axis emphasizes exponential growth trends, highlighting the importance of weight type selection in area-constrained systems.