## Line Chart: Test Accuracy vs. Number of Shots
### Overview
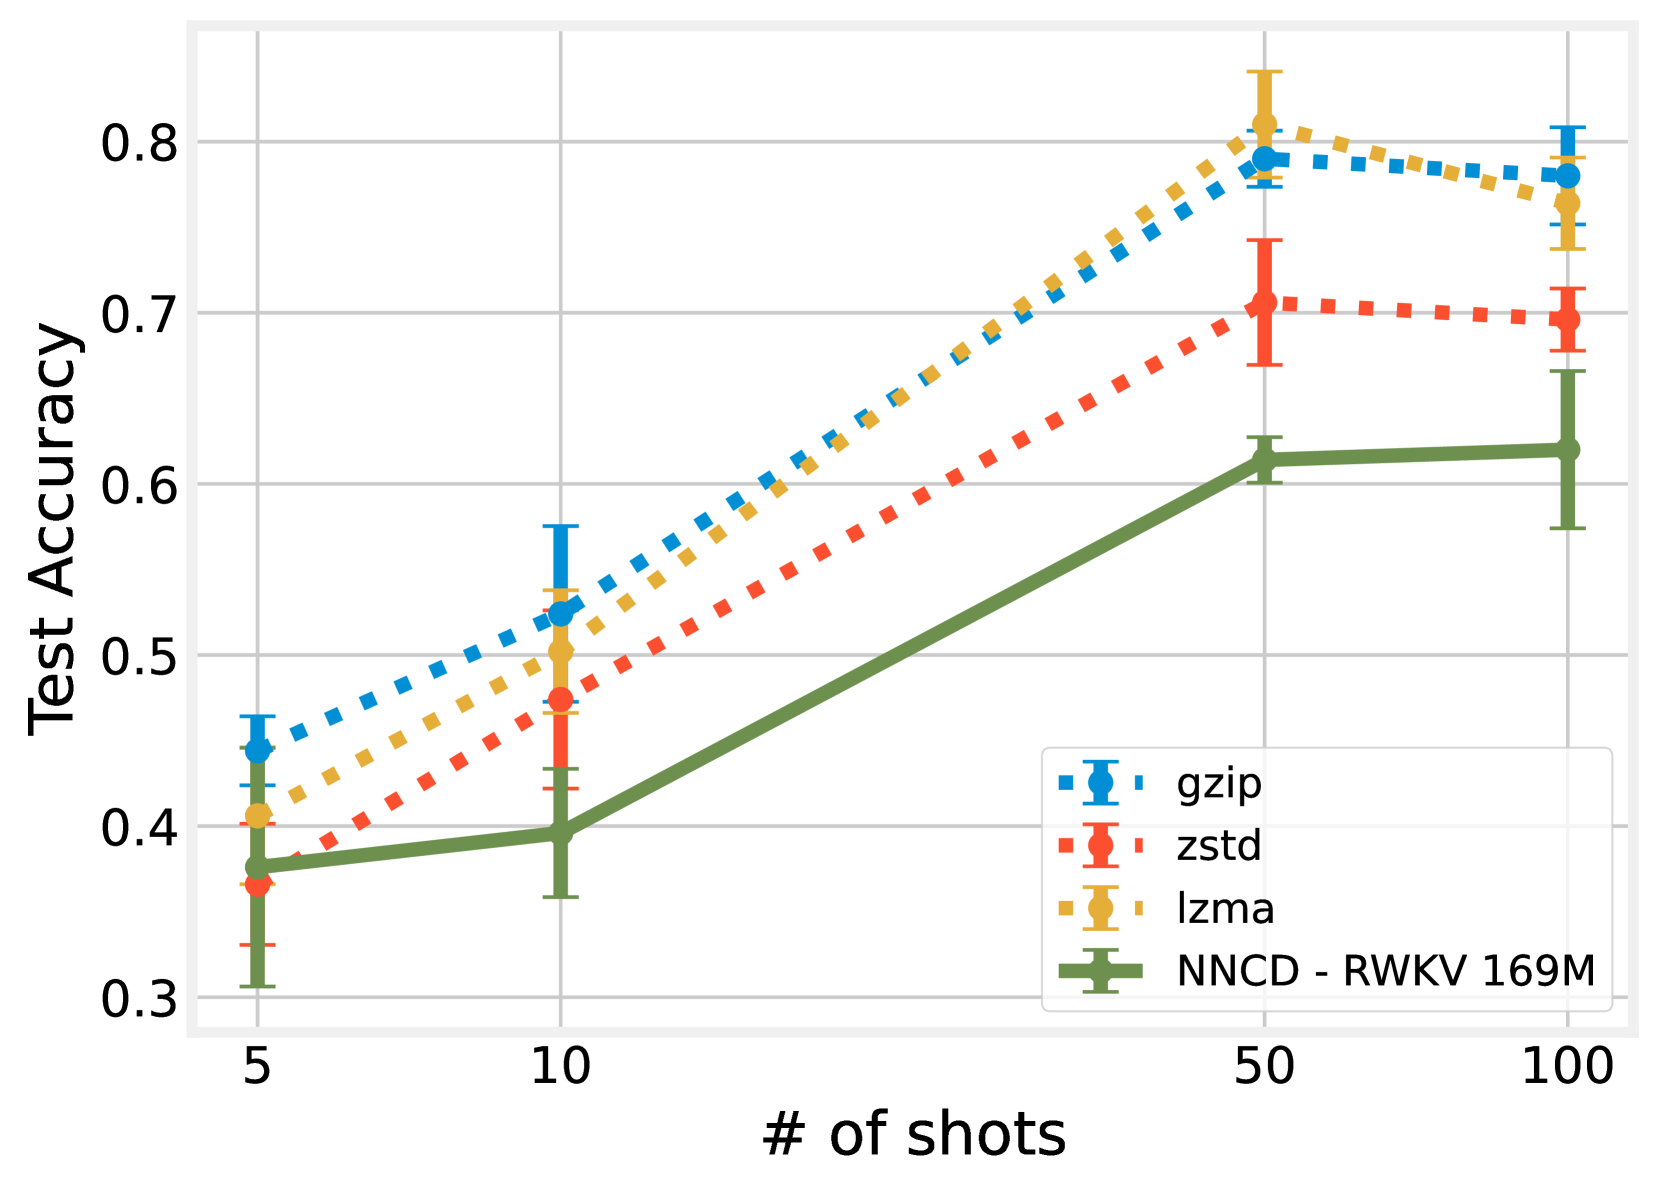
The chart compares the test accuracy of four compression algorithms (gzip, zstd, lzma, and NNCD - RWKV 169M) across varying numbers of shots (5, 10, 50, 100). Test accuracy is plotted on the y-axis (0.3–0.8), while the x-axis represents the number of shots. Each algorithm is represented by a distinct line style and color, with error bars indicating variability in performance.
### Components/Axes
- **Y-axis**: Test Accuracy (0.3–0.8, increments of 0.1)
- **X-axis**: Number of Shots (5, 10, 50, 100)
- **Legend**: Located in the bottom-right corner, mapping:
- **Blue (dashed line + square markers)**: gzip
- **Red (dotted line + diamond markers)**: zstd
- **Yellow (solid line + circle markers)**: lzma
- **Green (solid line + cross markers)**: NNCD - RWKV 169M
- **Error Bars**: Vertical lines extending from data points, representing confidence intervals.
### Detailed Analysis
1. **gzip (Blue)**:
- Starts at ~0.45 (5 shots), rises to ~0.78 (50 shots), then slightly declines to ~0.77 (100 shots).
- Error bars are largest at 50 and 100 shots, indicating higher variability.
2. **zstd (Red)**:
- Begins at ~0.37 (5 shots), increases to ~0.70 (50 shots), then drops to ~0.69 (100 shots).
- Error bars are moderate, with the largest spread at 50 shots.
3. **lzma (Yellow)**:
- Starts at ~0.41 (5 shots), peaks at ~0.80 (50 shots), then decreases to ~0.76 (100 shots).
- Error bars are smallest, suggesting consistent performance.
4. **NNCD - RWKV 169M (Green)**:
- Begins at ~0.37 (5 shots), rises steadily to ~0.62 (50 shots), then plateaus at ~0.63 (100 shots).
- Error bars are moderate, with the largest spread at 50 shots.
### Key Observations
- **Performance Trends**:
- All algorithms improve accuracy with more shots, except for minor declines at 100 shots for gzip, zstd, and lzma.
- **lzma** achieves the highest accuracy at 50 shots (~0.80), while **NNCD** remains the lowest (~0.63).
- **Error Variability**:
- gzip and zstd show the most variability (larger error bars), particularly at higher shot counts.
- lzma demonstrates the most stable performance (smallest error bars).
- **Diminishing Returns**:
- Accuracy gains plateau or slightly regress at 100 shots for most algorithms.
### Interpretation
The data suggests that increasing the number of shots generally improves test accuracy, but the rate of improvement diminishes beyond 50 shots. **lzma** outperforms other algorithms, potentially due to its compression efficiency or model architecture. **NNCD - RWKV 169M** lags behind, possibly due to suboptimal hyperparameters or training dynamics. The variability in gzip and zstd indicates sensitivity to input data distribution or implementation specifics. Error bars highlight the importance of statistical robustness in algorithm evaluation.