## Heatmap: Zero-shot - Core Generalization - o3-mini
### Overview
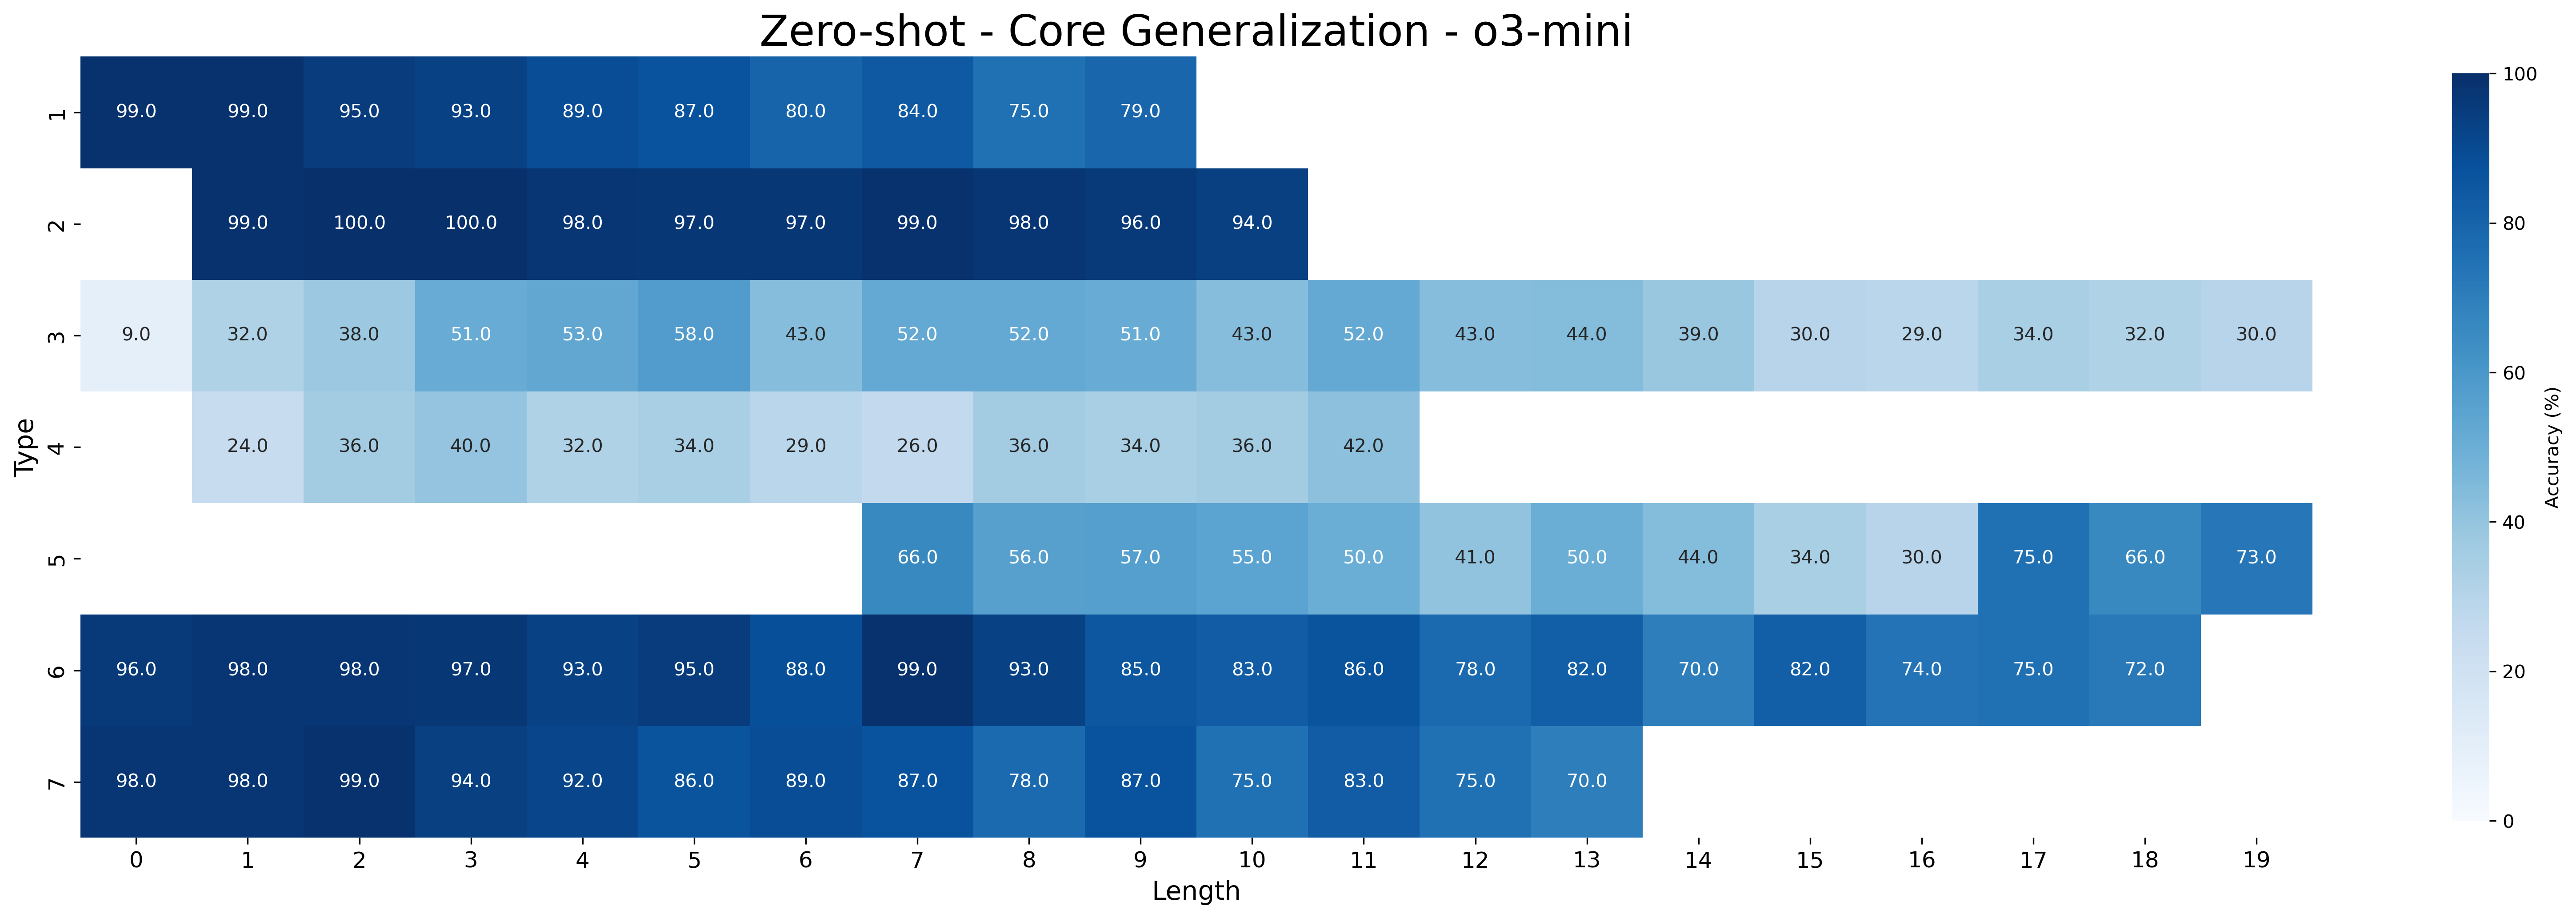
The image is a heatmap visualizing the accuracy (%) of a model across different "Types" and "Lengths". The color intensity represents the accuracy, with darker blue indicating higher accuracy and lighter blue indicating lower accuracy. The heatmap shows how the model's performance varies depending on the type and length of the input.
### Components/Axes
* **Title:** Zero-shot - Core Generalization - o3-mini
* **Y-axis:** "Type" with categories 1, 2, 3, 4, 5, 6, and 7.
* **X-axis:** "Length" ranging from 0 to 19.
* **Color Scale (Legend):** "Accuracy (%)" ranging from 0 to 100, with darker blues representing higher accuracy and lighter blues representing lower accuracy.
### Detailed Analysis
The heatmap displays accuracy values for each combination of "Type" and "Length". The values are explicitly written on each cell of the heatmap.
* **Type 1:** High accuracy (80-100%) for lengths 0-9, then drops off.
* Length 0: 99.0%
* Length 1: 99.0%
* Length 2: 95.0%
* Length 3: 93.0%
* Length 4: 89.0%
* Length 5: 87.0%
* Length 6: 80.0%
* Length 7: 84.0%
* Length 8: 75.0%
* Length 9: 79.0%
* **Type 2:** Consistently high accuracy (94-100%) across lengths 0-11.
* Length 0: 99.0%
* Length 1: 100.0%
* Length 2: 100.0%
* Length 3: 98.0%
* Length 4: 97.0%
* Length 5: 97.0%
* Length 6: 99.0%
* Length 7: 98.0%
* Length 8: 96.0%
* Length 9: 94.0%
* **Type 3:** Lower accuracy (9-58%) overall, with some increase in accuracy between lengths 0-5, then decreases.
* Length 0: 9.0%
* Length 1: 32.0%
* Length 2: 38.0%
* Length 3: 51.0%
* Length 4: 53.0%
* Length 5: 58.0%
* Length 6: 43.0%
* Length 7: 52.0%
* Length 8: 52.0%
* Length 9: 51.0%
* Length 10: 43.0%
* Length 11: 52.0%
* Length 12: 43.0%
* Length 13: 44.0%
* Length 14: 39.0%
* Length 15: 30.0%
* Length 16: 29.0%
* Length 17: 34.0%
* Length 18: 32.0%
* Length 19: 30.0%
* **Type 4:** Low to moderate accuracy (24-42%), with a peak around length 2.
* Length 1: 24.0%
* Length 2: 36.0%
* Length 3: 40.0%
* Length 4: 32.0%
* Length 5: 34.0%
* Length 6: 29.0%
* Length 7: 26.0%
* Length 8: 36.0%
* Length 9: 34.0%
* Length 10: 36.0%
* Length 11: 42.0%
* **Type 5:** Moderate accuracy (30-75%), with higher accuracy for lengths 17-19.
* Length 7: 66.0%
* Length 8: 56.0%
* Length 9: 57.0%
* Length 10: 55.0%
* Length 11: 50.0%
* Length 12: 41.0%
* Length 13: 50.0%
* Length 14: 44.0%
* Length 15: 34.0%
* Length 16: 30.0%
* Length 17: 75.0%
* Length 18: 66.0%
* Length 19: 73.0%
* **Type 6:** High accuracy (70-99%) across lengths 0-16, then drops off.
* Length 0: 96.0%
* Length 1: 98.0%
* Length 2: 98.0%
* Length 3: 97.0%
* Length 4: 93.0%
* Length 5: 95.0%
* Length 6: 88.0%
* Length 7: 99.0%
* Length 8: 93.0%
* Length 9: 85.0%
* Length 10: 83.0%
* Length 11: 86.0%
* Length 12: 78.0%
* Length 13: 82.0%
* Length 14: 70.0%
* Length 15: 82.0%
* Length 16: 74.0%
* Length 17: 75.0%
* Length 18: 72.0%
* **Type 7:** High accuracy (70-99%) across lengths 0-13, then drops off.
* Length 0: 98.0%
* Length 1: 98.0%
* Length 2: 99.0%
* Length 3: 94.0%
* Length 4: 92.0%
* Length 5: 86.0%
* Length 6: 89.0%
* Length 7: 87.0%
* Length 8: 78.0%
* Length 9: 87.0%
* Length 10: 75.0%
* Length 11: 83.0%
* Length 12: 75.0%
* Length 13: 70.0%
### Key Observations
* Types 1, 2, 6, and 7 generally exhibit higher accuracy compared to Types 3, 4, and 5.
* Accuracy tends to vary with length, with some types showing a decrease in accuracy as length increases.
* Type 2 shows the most consistent high accuracy across all lengths tested.
* Type 3 has the lowest accuracy overall.
### Interpretation
The heatmap provides insights into the zero-shot core generalization performance of the model. The model performs well on certain types (1, 2, 6, 7) regardless of length, while its performance on other types (3, 4, 5) is more sensitive to the length of the input. This suggests that the model may have learned certain patterns or features that are more relevant to some types than others. The drop in accuracy for some types as length increases could indicate limitations in the model's ability to handle longer sequences or a mismatch between the training data and the longer sequences used for evaluation. The data suggests that the model's generalization ability is not uniform across all types and lengths, highlighting areas for potential improvement.