# Technical Document Extraction: Zero-shot - Core Generalization - o3-mini
## 1. Title
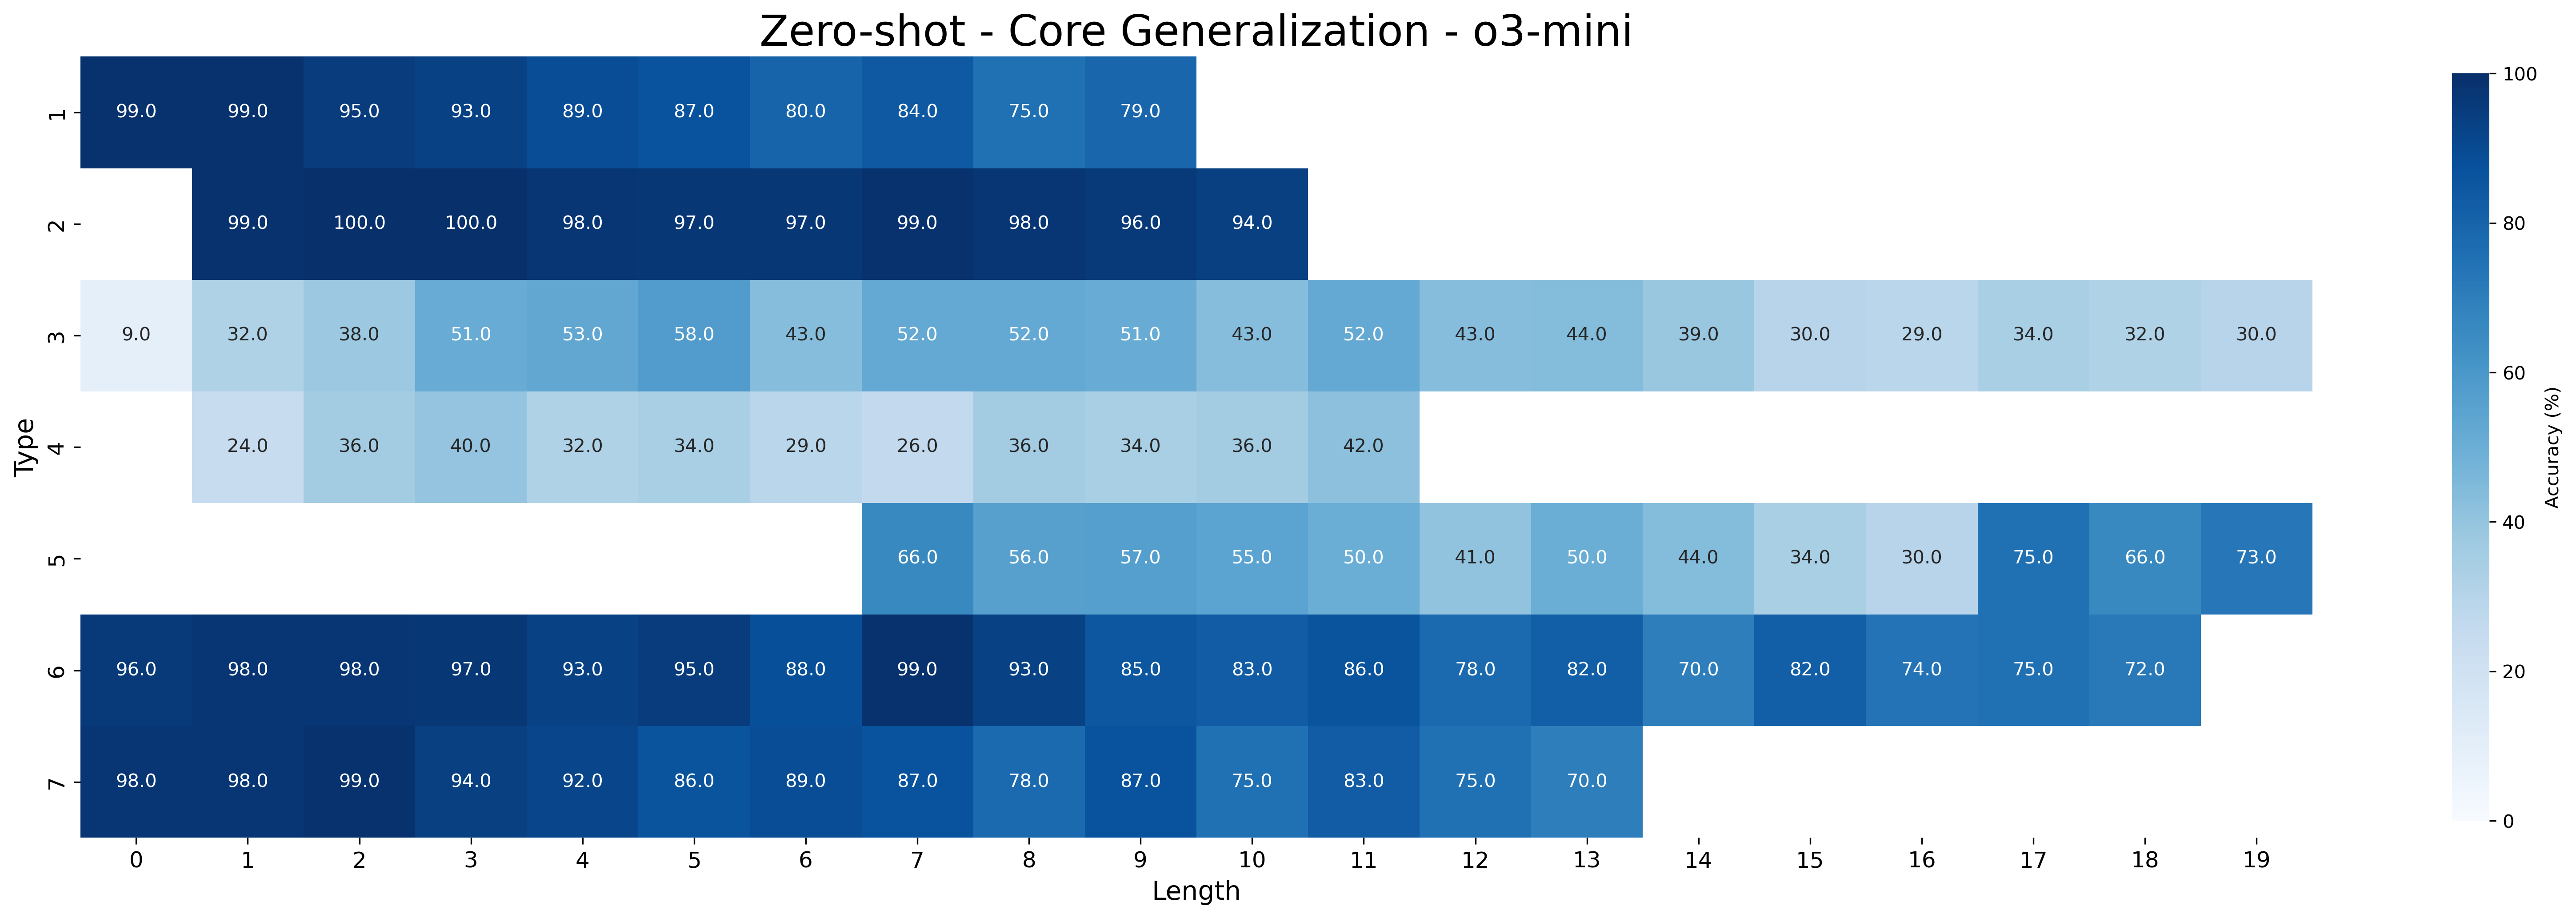
- **Title**: Zero-shot - Core Generalization - o3-mini
## 2. Axes and Labels
- **X-axis (Horizontal)**:
- **Label**: Length
- **Values**: 0, 1, 2, 3, 4, 5, 6, 7, 8, 9, 10, 11, 12, 13, 14, 15, 16, 17, 18, 19
- **Y-axis (Vertical)**:
- **Label**: Type
- **Values**: 1, 2, 3, 4, 5, 6, 7
## 3. Color Scale
- **Legend**: Accuracy (%)
- **Range**: 0% (lightest blue) to 100% (darkest blue)
- **Placement**: Right side of the heatmap
## 4. Data Table
### Heatmap Values (Type vs. Length)
| Type \ Length | 0 | 1 | 2 | 3 | 4 | 5 | 6 | 7 | 8 | 9 | 10 | 11 | 12 | 13 | 14 | 15 | 16 | 17 | 18 | 19 |
|---------------|------|------|------|------|------|------|------|------|------|------|------|------|------|------|------|------|------|------|------|------|
| **1** | 99.0 | 99.0 | 95.0 | 93.0 | 89.0 | 87.0 | 80.0 | 84.0 | 75.0 | 79.0 | - | - | - | - | - | - | - | - | - | - |
| **2** | - | 99.0 | 100.0| 97.0 | 98.0 | 97.0 | 97.0 | 99.0 | 98.0 | 96.0 | 94.0 | - | - | - | - | - | - | - | - | - |
| **3** | 9.0 | 32.0 | 38.0 | 51.0 | 53.0 | 58.0 | 43.0 | 52.0 | 52.0 | 51.0 | 43.0 | 52.0 | 43.0 | 44.0 | 39.0 | 30.0 | 29.0 | 34.0 | 32.0 | 30.0 |
| **4** | 24.0 | 36.0 | 40.0 | 32.0 | 34.0 | 29.0 | 26.0 | 36.0 | 34.0 | 36.0 | 42.0 | - | - | - | - | - | - | - | - | - |
| **5** | - | - | - | - | - | - | 66.0 | 56.0 | 57.0 | 55.0 | 50.0 | 41.0 | 50.0 | 44.0 | 34.0 | 30.0 | 75.0 | 66.0 | 73.0 |
| **6** | 96.0 | 98.0 | 98.0 | 97.0 | 93.0 | 95.0 | 88.0 | 99.0 | 93.0 | 85.0 | 83.0 | 86.0 | 78.0 | 82.0 | 70.0 | 82.0 | 74.0 | 75.0 | 72.0 | - |
| **7** | 98.0 | 98.0 | 99.0 | 94.0 | 92.0 | 86.0 | 89.0 | 87.0 | 78.0 | 87.0 | 75.0 | 83.0 | 75.0 | 70.0 | - | - | - | - | - | - |
## 5. Key Trends
1. **Type 1**:
- High accuracy (99-79%) across all lengths.
- Gradual decline with increasing length.
2. **Type 2**:
- Consistently high accuracy (94-100%).
- Peaks at Length 2 (100%) and Length 3 (97%).
3. **Type 3**:
- Low accuracy (9-58%) across all lengths.
- Peaks at Length 5 (58%) and Length 6 (43%).
4. **Type 4**:
- Moderate accuracy (24-42%) across all lengths.
- Peaks at Length 10 (42%).
5. **Type 5**:
- Moderate accuracy (30-75%) across lengths 7-19.
- Peaks at Length 17 (75%).
6. **Type 6**:
- High accuracy (70-99%) across lengths 0-16.
- Peaks at Length 0 (96%) and Length 7 (99%).
7. **Type 7**:
- High accuracy (70-99%) across lengths 0-13.
- Peaks at Length 0 (98%) and Length 2 (99%).
## 6. Spatial Grounding
- **Legend**: Located on the right side of the heatmap.
- **Data Points**: Numerical values embedded in cells match the color intensity of the legend.
## 7. Trend Verification
- **Type 1**: Slopes downward from 99% (Length 0) to 79% (Length 9).
- **Type 2**: Peaks at Length 2 (100%) and declines to 94% (Length 10).
- **Type 3**: Slopes upward from 9% (Length 0) to 58% (Length 5), then declines.
- **Type 4**: Slopes upward from 24% (Length 0) to 42% (Length 10).
- **Type 5**: Slopes downward from 66% (Length 7) to 30% (Length 15), then rises to 75% (Length 17).
- **Type 6**: Slopes downward from 96% (Length 0) to 74% (Length 16).
- **Type 7**: Slopes downward from 98% (Length 0) to 70% (Length 13).
## 8. Component Isolation
- **Header**: Title and axis labels.
- **Main Chart**: Heatmap with embedded numerical values.
- **Footer**: Color scale legend.
## 9. Language
- **Primary Language**: English
- **Translated Text**: None (all text is in English).
## 10. Missing Data
- Dashes (`-`) indicate missing values for certain Type-Length combinations.