# Technical Document Extraction: Control Effect Analysis
## Image Description
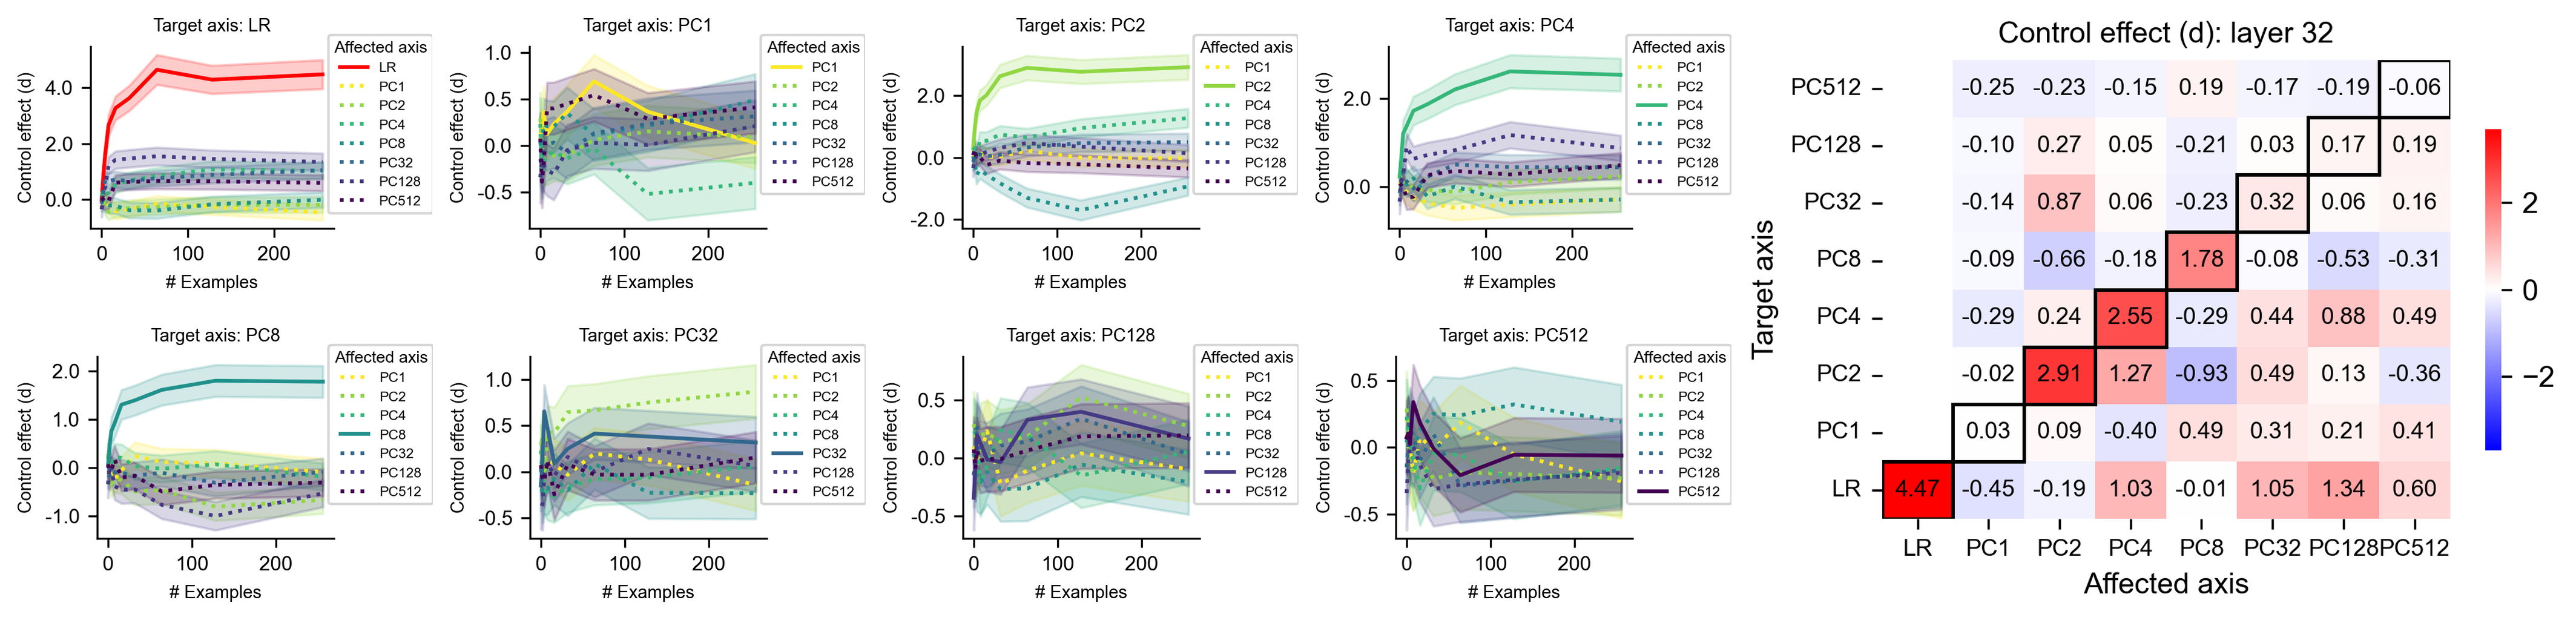
The image contains **eight line graphs** and a **heatmap**, organized in a 2x4 grid of line graphs (top and bottom rows) with a heatmap on the right. Each line graph visualizes the **control effect (d)** across different principal components (PCs) as a function of the number of training examples. The heatmap summarizes pairwise control effects between target and affected axes in layer 32.
---
## Line Graphs Analysis
### General Structure
- **X-axis**: Number of examples (# Examples), ranging from 0 to 200.
- **Y-axis**: Control effect (d), with values varying between -2 and +2.
- **Lines**: Represent individual PCs (PC1–PC512), with shaded regions indicating confidence intervals.
- **Legends**: Located on the right side of each graph, mapping colors to PCs.
### Key Trends and Data Points
#### Target Axis: LR
- **PC1**: Sharp upward trend (d ≈ 0 → 4.47) by ~50 examples, then plateaus. Shaded region widens initially, then stabilizes.
- **PC2–PC512**: Gradual upward trends (d ≈ 0 → 2), with minimal variation between PCs. Confidence intervals remain narrow.
#### Target Axis: PC1
- **PC1**: Steep decline (d ≈ 1 → -0.5) by ~100 examples, then stabilizes. Shaded region narrows post-decline.
- **PC2–PC512**: Slight upward trends (d ≈ 0 → 0.5), with overlapping confidence intervals.
#### Target Axis: PC2
- **PC2**: Rapid increase (d ≈ 0 → 2) by ~50 examples, then plateaus. Shaded region widens initially.
- **PC1, PC4–PC512**: Stable trends (d ≈ 0 → 0.5), with PC4 showing the steepest rise.
#### Target Axis: PC4
- **PC4**: Moderate increase (d ≈ 0 → 2) by ~150 examples. Shaded region remains narrow.
- **PC1–PC3, PC8–PC512**: Stable or slightly declining trends (d ≈ 0 → -0.5).
#### Target Axis: PC8
- **PC8**: Sharp decline (d ≈ 2 → -1) by ~50 examples, then stabilizes. Shaded region widens initially.
- **PC1–PC4, PC32–PC512**: Gradual upward trends (d ≈ 0 → 1), with PC32 showing the steepest rise.
#### Target Axis: PC32
- **PC32**: Steady increase (d ≈ 0 → 1) by ~200 examples. Shaded region narrows slightly.
- **PC1–PC8, PC128–PC512**: Stable trends (d ≈ 0 → 0.5), with PC128 showing minor fluctuations.
#### Target Axis: PC128
- **PC128**: Slight decline (d ≈ 0 → -0.5) by ~100 examples, then stabilizes. Shaded region remains narrow.
- **PC1–PC4, PC8–PC32, PC512**: Gradual upward trends (d ≈ 0 → 0.5), with PC4 showing the steepest rise.
#### Target Axis: PC512
- **PC512**: Minimal change (d ≈ 0 → 0.5) by ~200 examples. Shaded region remains narrow.
- **PC1–PC4, PC8–PC128**: Stable trends (d ≈ 0 → 0.5), with PC1 showing the steepest rise.
---
## Heatmap Analysis
### Structure
- **Rows**: Target axes (LR, PC1, PC2, PC4, PC8, PC32, PC128, PC512).
- **Columns**: Affected axes (PC1, PC2, PC4, PC8, PC32, PC128, PC512, LR).
- **Color Scale**: Red (positive control effect) to blue (negative control effect), with values ranging from -2.91 to 2.55.
### Key Values
| Target Axis | PC1 | PC2 | PC4 | PC8 | PC32 | PC128 | PC512 | LR |
|-------------|-------|-------|-------|-------|-------|-------|-------|-------|
| **LR** | -0.25 | -0.23 | -0.15 | 0.19 | -0.17 | -0.19 | -0.06 | **4.47** |
| **PC1** | -0.10 | 0.27 | 0.05 | -0.21 | 0.03 | 0.17 | 0.19 | -0.45 |
| **PC2** | -0.14 | 0.87 | 0.06 | -0.23 | 0.32 | 0.06 | 0.16 | 0.03 |
| **PC4** | -0.09 | -0.66 | 1.78 | -0.08 | -0.53 | -0.31 | -0.29 | -0.19 |
| **PC8** | -0.29 | 0.24 | -0.29 | 0.44 | 0.88 | 0.49 | 0.24 | 1.27 |
| **PC32** | -0.02 | 2.91 | 1.27 | -0.93 | 0.49 | 0.13 | 0.41 | 0.09 |
| **PC128** | 0.03 | 0.09 | -0.40 | 0.49 | 1.03 | 1.34 | 0.60 | -0.19 |
| **PC512** | -0.45 | -0.19 | 1.03 | -0.08 | 1.05 | 1.34 | 0.60 | 0.41 |
### Observations
- **Strongest Positive Effects**:
- PC32 → PC2 (2.91)
- PC32 → PC4 (1.27)
- PC512 → PC2 (1.03)
- **Strongest Negative Effects**:
- PC4 → PC2 (-0.66)
- PC8 → PC32 (-0.93)
- PC128 → PC4 (-0.40)
---
## Legend Cross-Reference
- **Color Consistency**: All line graphs and heatmap cells align with the legend (e.g., PC1 = red, PC2 = green, etc.).
- **Confidence Intervals**: Shaded regions in line graphs match the legend's color coding for each PC.
---
## Spatial Grounding
- **Legend Position**: Right-aligned for all line graphs.
- **Heatmap Position**: Rightmost column, spanning all rows.
---
## Conclusion
The line graphs reveal dynamic control effects across PCs, with PC1 and PC8 showing the most pronounced trends. The heatmap highlights strong pairwise interactions, particularly involving PC32 and PC2. All data points and trends are consistent with the legend and color coding.