## Scatter Plot: Accuracy vs. Token Count and Deep-Thinking Ratio
### Overview
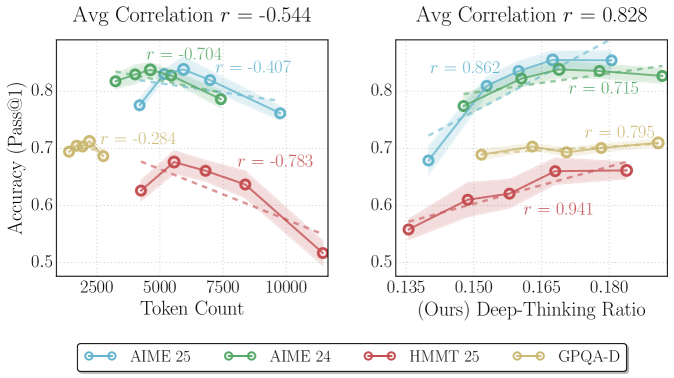
The image presents two scatter plots comparing the accuracy (Pass@1) of different models against two independent variables: Token Count (left plot) and Deep-Thinking Ratio (right plot). Each plot displays data for four models (AIME 25, AIME 24, HMMT 25, and GPQA-D), with shaded regions indicating uncertainty. Correlation coefficients (r) are provided for each plot and for some individual data series.
### Components/Axes
**Left Plot:**
* **Title:** Avg Correlation r = -0.544
* **X-axis:** Token Count, with tick marks at approximately 2500, 5000, 7500, and 10000.
* **Y-axis:** Accuracy (Pass@1), with tick marks at 0.5, 0.6, 0.7, and 0.8.
**Right Plot:**
* **Title:** Avg Correlation r = 0.828
* **X-axis:** (Ours) Deep-Thinking Ratio, with tick marks at approximately 0.135, 0.150, 0.165, and 0.180.
* **Y-axis:** Accuracy (Pass@1), with tick marks at 0.5, 0.6, 0.7, and 0.8.
**Legend (located at the bottom):**
* **Blue:** AIME 25
* **Green:** AIME 24
* **Red:** HMMT 25
* **Yellow:** GPQA-D
### Detailed Analysis
**Left Plot (Accuracy vs. Token Count):**
* **AIME 25 (Blue):** The line starts at approximately (2500, 0.7), increases slightly to (5000, 0.8), and then decreases to approximately (10000, 0.78). r = -0.704
* **AIME 24 (Green):** The line starts at approximately (2500, 0.7), increases slightly to (5000, 0.83), and then decreases to approximately (10000, 0.78). r = -0.407
* **HMMT 25 (Red):** The line starts at approximately (5000, 0.62), increases to (7500, 0.66), and then decreases to approximately (10000, 0.52). r = -0.783
* **GPQA-D (Yellow):** The line remains relatively constant at approximately 0.7 across the token count range. r = -0.284
**Right Plot (Accuracy vs. Deep-Thinking Ratio):**
* **AIME 25 (Blue):** The line starts at approximately (0.135, 0.57), increases to (0.165, 0.82), and then plateaus at approximately (0.180, 0.82). r = 0.862
* **AIME 24 (Green):** The line starts at approximately (0.135, 0.57), increases to (0.165, 0.83), and then plateaus at approximately (0.180, 0.82). r = 0.715
* **HMMT 25 (Red):** The line starts at approximately (0.135, 0.55), increases to (0.165, 0.66), and then plateaus at approximately (0.180, 0.67). r = 0.941
* **GPQA-D (Yellow):** The line remains relatively constant at approximately 0.7 across the Deep-Thinking Ratio range. r = 0.795
### Key Observations
* In the left plot, the AIME 25 and AIME 24 models show a slight increase in accuracy initially, followed by a decrease as the token count increases. HMMT 25 shows a more pronounced decrease in accuracy with increasing token count. GPQA-D remains relatively stable.
* In the right plot, all models except GPQA-D show an increase in accuracy as the Deep-Thinking Ratio increases, eventually plateauing. GPQA-D remains relatively stable.
* The average correlation for the left plot is negative (-0.544), indicating an inverse relationship between token count and accuracy across the models. The average correlation for the right plot is positive (0.828), indicating a direct relationship between Deep-Thinking Ratio and accuracy.
### Interpretation
The data suggests that increasing the token count may negatively impact the accuracy of some models (AIME 25, AIME 24, and HMMT 25), while the GPQA-D model is less sensitive to token count. In contrast, increasing the Deep-Thinking Ratio generally improves the accuracy of the models, with GPQA-D again showing less sensitivity. The negative correlation in the left plot and the positive correlation in the right plot highlight these relationships. The shaded regions around the lines indicate the variability or uncertainty in the accuracy measurements for each model. The correlation coefficients for each line provide a measure of the strength and direction of the linear relationship between the variables for each model.