\n
## Charts: Accuracy vs. Token Count & Deep-Thinking Ratio
### Overview
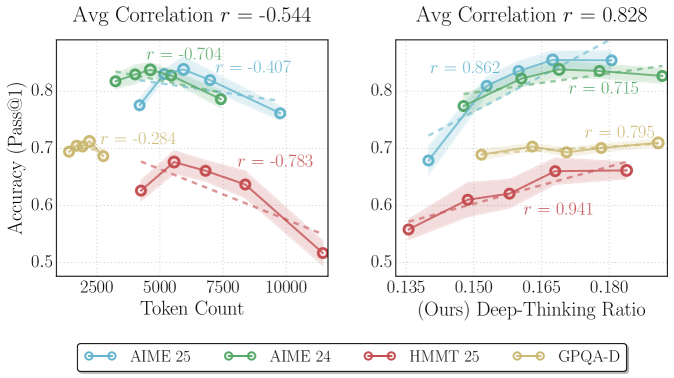
The image presents two charts comparing the accuracy of different models (AIME 25, AIME 24, HMMT 25, and GPQA-D) under varying conditions. The left chart shows accuracy (Pass@1) as a function of token count, while the right chart shows accuracy as a function of a "Deep-Thinking Ratio". Each chart includes shaded regions representing confidence intervals around the data.
### Components/Axes
**Left Chart:**
* **X-axis:** Token Count (ranging from approximately 2500 to 10000)
* **Y-axis:** Accuracy (Pass@1) (ranging from approximately 0.5 to 0.9)
* **Title:** "Avg Correlation r = -0.544"
* **Data Series:**
* AIME 25 (Light Blue)
* AIME 24 (Green)
* HMMT 25 (Red)
* GPQA-D (Yellow)
**Right Chart:**
* **X-axis:** Deep-Thinking Ratio (ranging from approximately 0.135 to 0.180) labeled as "(Ours) Deep-Thinking Ratio"
* **Y-axis:** Accuracy (Pass@1) (ranging from approximately 0.5 to 0.9)
* **Title:** "Avg Correlation r = 0.828"
* **Data Series:**
* AIME 25 (Light Blue)
* AIME 24 (Green)
* HMMT 25 (Red)
* GPQA-D (Yellow)
**Legend:** Located at the bottom center of the image. It maps colors to model names:
* AIME 25 (Light Blue)
* AIME 24 (Green)
* HMMT 25 (Red)
* GPQA-D (Yellow)
### Detailed Analysis or Content Details
**Left Chart (Accuracy vs. Token Count):**
* **AIME 25 (Light Blue):** Starts at approximately 0.82 at 2500 tokens, rises to a peak of approximately 0.84 at 5000 tokens, then declines to approximately 0.78 at 10000 tokens. The correlation coefficient (r) is -0.704.
* **AIME 24 (Green):** Starts at approximately 0.81 at 2500 tokens, rises to a peak of approximately 0.83 at 5000 tokens, then declines to approximately 0.76 at 10000 tokens. The correlation coefficient (r) is -0.407.
* **HMMT 25 (Red):** Starts at approximately 0.68 at 2500 tokens, decreases to approximately 0.64 at 5000 tokens, and then rises slightly to approximately 0.66 at 10000 tokens. The correlation coefficient (r) is -0.783.
* **GPQA-D (Yellow):** Starts at approximately 0.71 at 2500 tokens, decreases to approximately 0.67 at 5000 tokens, and then rises slightly to approximately 0.69 at 10000 tokens. The correlation coefficient (r) is -0.284.
**Right Chart (Accuracy vs. Deep-Thinking Ratio):**
* **AIME 25 (Light Blue):** Starts at approximately 0.75 at 0.135, rises steadily to approximately 0.91 at 0.180. The correlation coefficient (r) is 0.862.
* **AIME 24 (Green):** Starts at approximately 0.76 at 0.135, rises steadily to approximately 0.86 at 0.180. The correlation coefficient (r) is 0.715.
* **HMMT 25 (Red):** Starts at approximately 0.60 at 0.135, rises steadily to approximately 0.71 at 0.180. The correlation coefficient (r) is 0.941.
* **GPQA-D (Yellow):** Starts at approximately 0.66 at 0.135, rises steadily to approximately 0.78 at 0.180. The correlation coefficient (r) is 0.795.
### Key Observations
* **Left Chart:** Accuracy generally *decreases* with increasing token count for AIME 25 and AIME 24, while HMMT 25 and GPQA-D show a more complex relationship. The negative correlation coefficient (-0.544) indicates a general inverse relationship between token count and accuracy.
* **Right Chart:** Accuracy generally *increases* with increasing Deep-Thinking Ratio for all models. The positive correlation coefficient (0.828) indicates a strong positive relationship between Deep-Thinking Ratio and accuracy.
* AIME 25 consistently demonstrates the highest accuracy in the right chart.
* HMMT 25 and GPQA-D have lower accuracy compared to AIME 25 and AIME 24 in both charts.
### Interpretation
The data suggests that increasing the token count does not necessarily lead to improved accuracy, and may even be detrimental for some models (AIME 25 and AIME 24). This could indicate that these models are reaching a point of diminishing returns with longer input sequences, or that the increased token count introduces noise or irrelevant information.
Conversely, increasing the Deep-Thinking Ratio consistently improves accuracy across all models. This suggests that allowing the models to engage in more complex reasoning processes is beneficial for performance. The strong positive correlation between Deep-Thinking Ratio and accuracy supports this interpretation.
The difference in performance between the AIME models and the HMMT/GPQA-D models suggests that the AIME models may be better equipped to handle complex reasoning tasks or benefit more from increased computational resources. The outliers in the data (e.g., the peak accuracy of AIME 25 at 5000 tokens in the left chart) could be due to specific characteristics of the dataset or the model architecture. Further investigation would be needed to understand these anomalies.