## Line Charts: Accuracy vs. Token Count and Deep-Thinking Ratio
### Overview
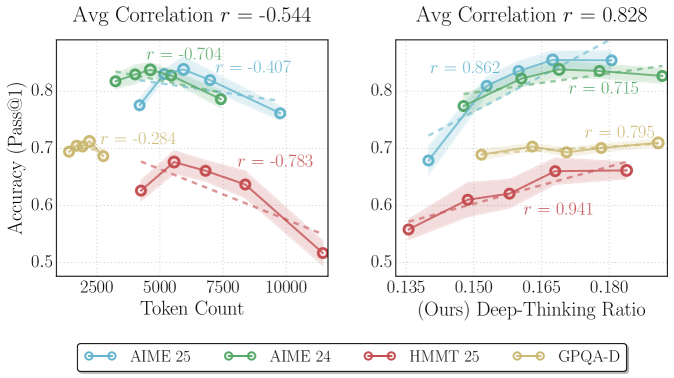
The image contains two side-by-side line charts comparing model performance metrics. The left chart plots accuracy against token count, while the right chart plots accuracy against a "Deep-Thinking Ratio." Both charts include four data series with distinct colors and correlation coefficients (r-values) indicating relationships between variables.
### Components/Axes
**Left Chart (Token Count vs. Accuracy):**
- **X-axis**: Token Count (2500–10000, increments of 2500)
- **Y-axis**: Accuracy (Pass@1) (0.5–0.8, increments of 0.1)
- **Legend**: Located at the bottom, mapping colors to models:
- Blue: AIME 25
- Green: AIME 24
- Red: HMMT 25
- Yellow: GPQA-D
- **Correlation Labels**: Overlaid on lines with r-values:
- AIME 25: r = -0.704
- AIME 24: r = -0.407
- HMMT 25: r = -0.783
- GPQA-D: r = -0.284
- **Title**: "Avg Correlation r = -0.544"
**Right Chart (Deep-Thinking Ratio vs. Accuracy):**
- **X-axis**: Deep-Thinking Ratio (0.135–0.180, increments of 0.015)
- **Y-axis**: Accuracy (Pass@1) (0.5–0.8, increments of 0.1)
- **Legend**: Same as left chart (bottom placement)
- **Correlation Labels**: Overlaid on lines with r-values:
- AIME 25: r = 0.862
- AIME 24: r = 0.715
- HMMT 25: r = 0.941
- GPQA-D: r = 0.795
- **Title**: "Avg Correlation r = 0.828"
### Detailed Analysis
**Left Chart Trends:**
1. **AIME 25 (Blue)**: Starts at ~0.8 accuracy at 2500 tokens, declines steadily to ~0.75 at 10,000 tokens (r = -0.704).
2. **AIME 24 (Green)**: Peaks at ~0.78 at 5000 tokens, then declines to ~0.72 at 10,000 tokens (r = -0.407).
3. **HMMT 25 (Red)**: Starts at ~0.65 at 2500 tokens, declines sharply to ~0.5 at 10,000 tokens (r = -0.783).
4. **GPQA-D (Yellow)**: Flat line at ~0.7 across all token counts (r = -0.284).
**Right Chart Trends:**
1. **AIME 25 (Blue)**: Increases from ~0.68 at 0.135 ratio to ~0.82 at 0.180 ratio (r = 0.862).
2. **AIME 24 (Green)**: Rises from ~0.7 to ~0.78, plateauing at higher ratios (r = 0.715).
3. **HMMT 25 (Red)**: Steep upward trend from ~0.55 to ~0.68 (r = 0.941).
4. **GPQA-D (Yellow)**: Gradual increase from ~0.65 to ~0.72 (r = 0.795).
### Key Observations
- **Negative Correlation (Left Chart)**: All models except GPQA-D show declining accuracy with increased token count. HMMT 25 has the steepest decline (r = -0.783).
- **Positive Correlation (Right Chart)**: All models improve accuracy with higher deep-thinking ratios. HMMT 25 demonstrates the strongest positive relationship (r = 0.941).
- **GPQA-D Anomaly**: Maintains stable accuracy across token counts (left chart) but shows moderate improvement with deep-thinking ratio (right chart).
### Interpretation
The data suggests a trade-off between computational resource usage (token count) and performance. Models like HMMT 25 and AIME 25 exhibit diminishing returns with increased token count but benefit significantly from deeper reasoning (higher deep-thinking ratios). GPQA-D’s stability across token counts implies efficiency but limited scalability. The stark contrast in correlation magnitudes (-0.544 vs. +0.828) highlights that deep-thinking ratio is a more reliable predictor of accuracy than raw token count. This aligns with Peircean principles of abductive reasoning: the simplest explanation (ratio-driven performance) accounts for observed patterns without overcomplicating the model.