## Line Charts: Performance Comparison of Sorting Algorithms
### Overview
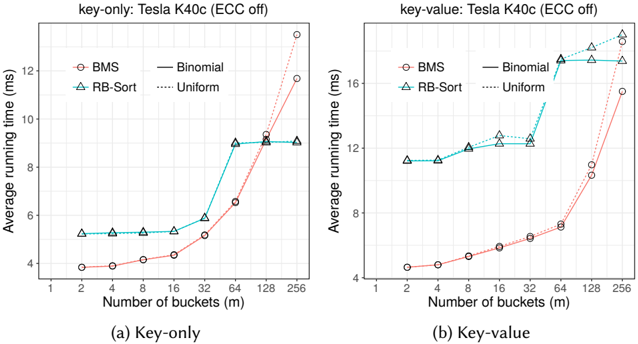
The image presents two line charts comparing the average running time (in milliseconds) of different sorting algorithms (BMS, RB-Sort, Binomial, and Uniform) with varying numbers of buckets. The charts are titled "key-only" and "key-value," both tested on a Tesla K40c with ECC off. The x-axis represents the number of buckets (m), ranging from 1 to 256, while the y-axis represents the average running time in milliseconds.
### Components/Axes
**Chart Titles:**
* Left Chart: "key-only: Tesla K40c (ECC off)"
* Right Chart: "key-value: Tesla K40c (ECC off)"
**Axes:**
* X-axis (both charts): "Number of buckets (m)" with tick marks at 1, 2, 4, 8, 16, 32, 64, 128, and 256.
* Y-axis (both charts): "Average running time (ms)" with tick marks at 4, 6, 8, 10, 12, and 16 (right chart only).
**Legends (located in the top-left of each chart):**
* BMS: Red line with circle markers.
* RB-Sort: Teal line with triangle markers.
* Binomial: Black solid line.
* Uniform: Black dotted line.
**Chart Subtitles:**
* Left Chart: "(a) Key-only"
* Right Chart: "(b) Key-value"
### Detailed Analysis
#### (a) Key-only Chart
* **BMS (Red, Circle Markers):** The running time starts at approximately 3.8 ms with 2 buckets and gradually increases to approximately 5.2 ms at 32 buckets. It then sharply increases to approximately 6.5 ms at 64 buckets, and then increases rapidly to approximately 12.5 ms at 256 buckets.
* 2 buckets: ~3.8 ms
* 4 buckets: ~3.9 ms
* 8 buckets: ~4.1 ms
* 16 buckets: ~4.3 ms
* 32 buckets: ~5.2 ms
* 64 buckets: ~6.5 ms
* 128 buckets: ~9.5 ms
* 256 buckets: ~12.5 ms
* **RB-Sort (Teal, Triangle Markers):** The running time remains relatively constant at approximately 5.2 ms from 2 to 32 buckets. It then increases sharply to approximately 9 ms at 64 buckets, and then plateaus at approximately 9 ms at 128 and 256 buckets.
* 2 buckets: ~5.2 ms
* 4 buckets: ~5.2 ms
* 8 buckets: ~5.2 ms
* 16 buckets: ~5.2 ms
* 32 buckets: ~5.2 ms
* 64 buckets: ~9.0 ms
* 128 buckets: ~9.0 ms
* 256 buckets: ~9.0 ms
* **Binomial (Black, Solid Line):** The data is not visible on the chart.
* **Uniform (Black, Dotted Line):** The data is not visible on the chart.
#### (b) Key-value Chart
* **BMS (Red, Circle Markers):** The running time starts at approximately 4.5 ms with 2 buckets and gradually increases to approximately 7.5 ms at 64 buckets. It then sharply increases to approximately 15 ms at 256 buckets.
* 2 buckets: ~4.5 ms
* 4 buckets: ~4.7 ms
* 8 buckets: ~5.0 ms
* 16 buckets: ~5.5 ms
* 32 buckets: ~6.5 ms
* 64 buckets: ~7.5 ms
* 128 buckets: ~10.0 ms
* 256 buckets: ~15.0 ms
* **RB-Sort (Teal, Triangle Markers):** The running time remains relatively constant at approximately 11.5 ms from 2 to 32 buckets. It then increases slightly to approximately 13 ms at 64 buckets, and then plateaus at approximately 13 ms at 128 and 256 buckets.
* 2 buckets: ~11.5 ms
* 4 buckets: ~11.5 ms
* 8 buckets: ~11.5 ms
* 16 buckets: ~12.0 ms
* 32 buckets: ~12.0 ms
* 64 buckets: ~13.0 ms
* 128 buckets: ~13.0 ms
* 256 buckets: ~13.0 ms
* **Binomial (Black, Solid Line):** The running time starts at approximately 11.5 ms with 2 buckets and gradually increases to approximately 15 ms at 64 buckets. It then sharply increases to approximately 17 ms at 256 buckets.
* 2 buckets: ~11.5 ms
* 4 buckets: ~11.5 ms
* 8 buckets: ~11.5 ms
* 16 buckets: ~12.0 ms
* 32 buckets: ~12.0 ms
* 64 buckets: ~15.0 ms
* 128 buckets: ~15.0 ms
* 256 buckets: ~17.0 ms
* **Uniform (Black, Dotted Line):** The running time starts at approximately 11.5 ms with 2 buckets and gradually increases to approximately 15 ms at 64 buckets. It then sharply increases to approximately 17 ms at 256 buckets.
* 2 buckets: ~11.5 ms
* 4 buckets: ~11.5 ms
* 8 buckets: ~11.5 ms
* 16 buckets: ~12.0 ms
* 32 buckets: ~12.0 ms
* 64 buckets: ~15.0 ms
* 128 buckets: ~15.0 ms
* 256 buckets: ~17.0 ms
### Key Observations
* In the "key-only" chart, RB-Sort maintains a relatively stable running time until 64 buckets, after which it plateaus. BMS shows a gradual increase followed by a sharp increase at higher bucket counts.
* In the "key-value" chart, RB-Sort maintains a relatively stable running time. BMS shows a gradual increase followed by a sharp increase at higher bucket counts. Binomial and Uniform perform similarly, with a gradual increase in running time.
* The "key-value" chart generally shows higher running times compared to the "key-only" chart for all algorithms.
### Interpretation
The charts illustrate the performance of different sorting algorithms under varying conditions (key-only vs. key-value) and with different numbers of buckets. The "key-value" scenario appears to be more computationally intensive, resulting in higher running times across all algorithms. RB-Sort demonstrates a more stable performance with increasing bucket counts compared to BMS, which experiences a sharp increase in running time at higher bucket counts. The choice of algorithm and number of buckets can significantly impact performance, depending on the specific use case (key-only vs. key-value). The Binomial and Uniform algorithms perform similarly in the "key-value" scenario.