## Performance Comparison of Sorting Algorithms on Tesla K40c GPU
### Overview
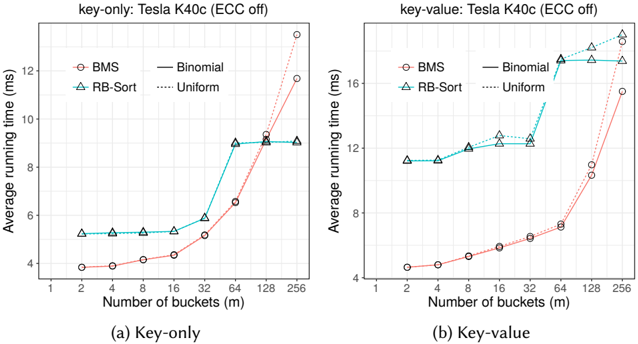
The image contains two side-by-side line charts comparing the performance (average running time) of four different sorting algorithms or data distributions on a Tesla K40c GPU with ECC turned off. The left chart (a) is for a "Key-only" workload, and the right chart (b) is for a "Key-value" workload. Performance is measured against an increasing number of buckets (`m`).
### Components/Axes
**Common Elements:**
* **X-Axis (Both Charts):** Label: `Number of buckets (m)`. Scale: Logarithmic base 2. Ticks/Markers: 1, 2, 4, 8, 16, 32, 64, 128, 256.
* **Y-Axis (Both Charts):** Label: `Average running time (ms)`. Scale: Linear.
* **Legend (Top-Left of each chart):** Contains four entries:
1. `BMS` - Red circle marker, solid red line.
2. `RB-Sort` - Teal triangle marker, solid teal line.
3. `Binomial` - Black solid line (no marker).
4. `Uniform` - Black dotted line (no marker).
* **Chart Titles:**
* (a) `key-only: Tesla K40c (ECC off)`
* (b) `key-value: Tesla K40c (ECC off)`
* **Sub-captions:** `(a) Key-only` and `(b) Key-value` below each respective chart.
**Chart-Specific Y-Axis Ranges:**
* **Chart (a) Key-only:** Y-axis ranges from 4 to 12 ms, with major ticks at 4, 6, 8, 10, 12.
* **Chart (b) Key-value:** Y-axis ranges from 4 to 16 ms, with major ticks at 4, 8, 12, 16.
### Detailed Analysis
**Chart (a) Key-only:**
* **BMS (Red Circle):** Starts at ~3.9 ms (m=1). Shows a slow, steady increase until m=32 (~5.2 ms). Then increases sharply, reaching ~6.5 ms at m=64, ~9.0 ms at m=128, and ~11.6 ms at m=256. Trend: Exponential-like increase after m=32.
* **RB-Sort (Teal Triangle):** Starts at ~5.2 ms (m=1). Remains nearly flat until m=16 (~5.4 ms). Increases to ~5.9 ms at m=32, then jumps to ~9.0 ms at m=64. Plateaus at ~9.0 ms for m=128 and m=256. Trend: Step-function increase, plateauing after m=64.
* **Binomial (Solid Black Line):** Follows the RB-Sort line almost exactly for all data points. Its values are indistinguishable from RB-Sort in this chart.
* **Uniform (Dotted Black Line):** Follows the BMS line almost exactly for all data points. Its values are indistinguishable from BMS in this chart.
**Chart (b) Key-value:**
* **BMS (Red Circle):** Starts at ~4.5 ms (m=1). Increases gradually to ~6.5 ms at m=32. Then increases more steeply to ~7.2 ms at m=64, ~10.5 ms at m=128, and ~15.5 ms at m=256. Trend: Accelerating increase.
* **RB-Sort (Teal Triangle):** Starts at ~11.2 ms (m=1). Remains flat until m=8 (~11.2 ms). Increases to ~12.0 ms at m=16, plateaus at ~12.2 ms for m=32, then jumps to ~14.5 ms at m=64. Increases further to ~17.5 ms at m=128 and ~18.0 ms at m=256. Trend: Stepwise increase with plateaus.
* **Binomial (Solid Black Line):** Again, follows the RB-Sort line almost exactly.
* **Uniform (Dotted Black Line):** Follows the BMS line almost exactly.
### Key Observations
1. **Performance Crossover:** In both charts, the BMS/Uniform pair starts faster (lower running time) than the RB-Sort/Binomial pair for small `m`. However, BMS/Uniform's running time grows more rapidly with `m`. In chart (a), they cross between m=64 and m=128. In chart (b), they cross between m=128 and m=256.
2. **Algorithm Pairing:** The performance of `BMS` is nearly identical to the `Uniform` distribution, and the performance of `RB-Sort` is nearly identical to the `Binomial` distribution in both workloads.
3. **Workload Impact:** The "Key-value" workload (chart b) results in higher absolute running times for all algorithms compared to the "Key-only" workload (chart a). The difference is most pronounced for the RB-Sort/Binomial pair at low `m`.
4. **Plateau Behavior:** RB-Sort/Binomial exhibit clear performance plateaus (e.g., m=1-16 in chart a; m=1-8 and m=16-32 in chart b), suggesting their performance is insensitive to bucket count within certain ranges.
### Interpretation
This data demonstrates a fundamental trade-off between two classes of sorting approaches on this GPU architecture. The **BMS/Uniform** approach has lower overhead for small numbers of buckets but scales poorly as the bucket count increases, likely due to increased memory access patterns or thread divergence. The **RB-Sort/Binomial** approach has higher initial overhead but scales better for larger bucket counts, with performance that is stable across certain ranges.
The near-perfect overlap between `BMS` and `Uniform`, and between `RB-Sort` and `Binomial`, strongly suggests that the performance characteristic is dominated by the underlying data distribution (Uniform vs. Binomial) rather than the specific algorithm name (BMS vs. RB-Sort) in this test. The choice between these approaches would depend on the expected operational range of `m`. For applications using fewer than ~64 buckets (key-only) or ~128 buckets (key-value), BMS/Uniform is preferable. For applications requiring more buckets, RB-Sort/Binomial becomes the better choice despite its higher initial cost. The "Key-value" workload adds a consistent performance penalty, likely due to the cost of moving and comparing paired data.