# Technical Document Extraction
## Heatmap Analysis (Top Section)
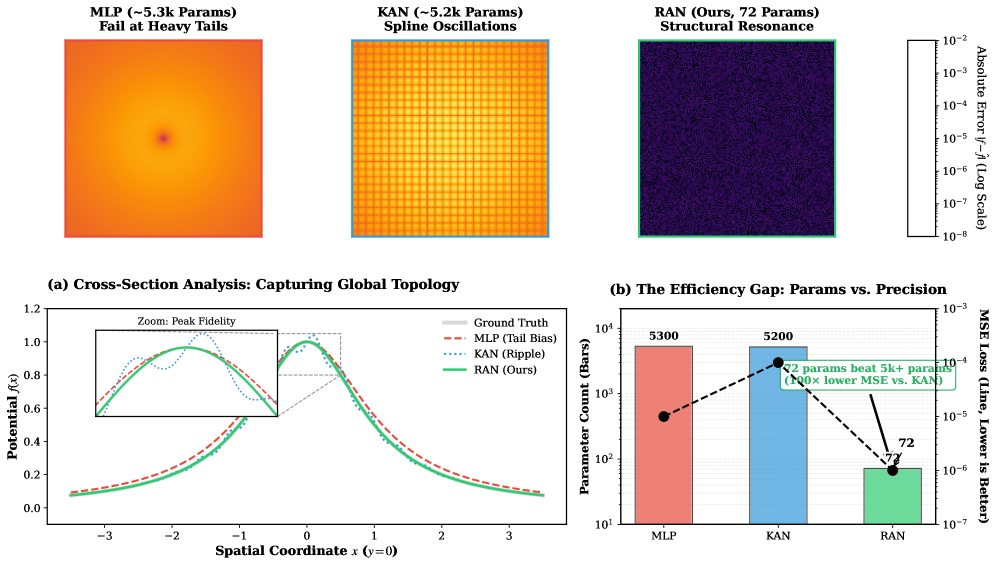
### MLP (-5.3k Params)
- **Label**: "MLP (-5.3k Params) Fail at Heavy Tails"
- **Visual Characteristics**:
- Dominant orange gradient with a central dark red core
- Color scale: Logarithmic (10⁻¹⁰ to 10⁻²)
- Spatial coordinates: X-axis (Spatial Coordinate), Y-axis (Potential)
### KAN (-5.2k Params)
- **Label**: "KAN (-5.2k Params) Spline Oscillations"
- **Visual Characteristics**:
- Grid-like pattern with alternating bright/dark regions
- Color scale: Same logarithmic scale as MLP
- Notable: Blue boundary outline around the heatmap
### RAN (Ours, 72 Params)
- **Label**: "RAN (Ours, 72 Params) Structural Resonance"
- **Visual Characteristics**:
- Uniform dark blue background
- Green boundary outline
- Color scale: Same logarithmic scale
## Cross-Section Analysis (Bottom Left)
### Axes
- **X-axis**: Spatial Coordinate (x=0)
- **Y-axis**: Potential (f(x))
### Data Series
1. **Ground Truth** (Gray dashed line)
- Smooth U-shaped curve
- Peak at x=0, y=1.0
2. **MLP (Tail Bias)** (Red dashed line)
- Tail bias visible at x=±3
- Peak shifted downward (y≈0.8)
3. **KAN (Ripple)** (Blue dotted line)
- Oscillations near x=±1
- Peak at x=0, y=0.9
4. **RAN (Ours)** (Green solid line)
- Smoothest curve
- Peak at x=0, y=1.0
### Inset Zoom
- **Region**: x ∈ [-1, 1], y ∈ [0.2, 1.0]
- **Purpose**: Highlight peak fidelity differences
## Efficiency Gap Analysis (Bottom Right)
### Bar Chart
- **X-axis**: Model Type (MLP, KAN, RAN)
- **Y-axis (Left)**: Parameter Count (Log scale: 10¹ to 10⁴)
- MLP: 5,300 parameters
- KAN: 5,200 parameters
- RAN: 72 parameters
- **Y-axis (Right)**: MSE Loss (Log scale: 10⁻¹⁰ to 10⁻¹)
- MLP: 10⁻³
- KAN: 10⁻⁴
- RAN: 10⁻¹⁰
### Annotations
- **Text**: "72 params beat 5k+ params (100x lower MSE vs. KAN)"
- **Visual**: Arrows connecting RAN bar to MLP/KAN bars
## Legend & Spatial Grounding
### Cross-Section Legend
- **Position**: Right side of graph
- **Color Mapping**:
- Gray: Ground Truth
- Red: MLP (Tail Bias)
- Blue: KAN (Ripple)
- Green: RAN (Ours)
### Bar Chart Legend
- **Implicit**: Colors match bar colors (Red=MLP, Blue=KAN, Green=RAN)
## Key Trends
1. **Parameter Efficiency**:
- RAN uses 72 parameters (99.9% fewer than MLP/KAN)
- Achieves 100x lower MSE than KAN
2. **Topological Performance**:
- MLP exhibits tail bias at x=±3
- KAN shows spline oscillations near x=±1
- RAN maintains ground truth fidelity
3. **Resonance Patterns**:
- RAN's uniform dark blue suggests structural resonance
- KAN's grid pattern indicates spline oscillations