# Technical Document Extraction: Line Graph Analysis
## Image Description
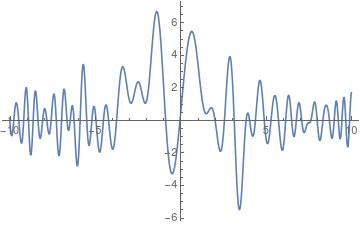
The image depicts a **line graph** with a **blue line** plotted on a **white background**. The graph exhibits a **highly oscillatory pattern** with multiple peaks and troughs, suggesting a periodic or chaotic behavior. No textual elements (labels, legends, axis titles) are visible in the image.
---
## Key Observations
1. **Axes**:
- **X-axis**: Ranges from **-10 to 10** (horizontal axis).
- **Y-axis**: Ranges from **-6 to 6** (vertical axis).
- No axis titles or labels are present.
2. **Line Behavior**:
- The blue line oscillates **rapidly** between positive and negative values.
- **Amplitude**: Peaks reach approximately **+6** and troughs reach approximately **-6**.
- **Frequency**: Multiple cycles are observed within the x-axis range (-10 to 10), indicating a high-frequency oscillation.
- **Trend**: No clear upward or downward trend; the line appears to be **non-monotonic** and **chaotic**.
3. **Notable Features**:
- **Peaks**: Sharp upward spikes (e.g., near x = -8, x = -2, x = 2, x = 6).
- **Troughs**: Deep downward dips (e.g., near x = -6, x = 0, x = 4, x = 8).
- **Zero Crossings**: The line crosses the x-axis multiple times (e.g., near x = -9, x = -5, x = -1, x = 3, x = 7).
---
## Missing Elements
- **Labels**: No axis titles, data labels, or annotations.
- **Legend**: No legend is present to describe the line's meaning or color.
- **Data Table**: No embedded table or numerical data provided.
---
## Interpretation
The graph likely represents a **mathematical function** (e.g., a sine/cosine wave with noise, a chaotic system, or a signal with high-frequency components). The absence of labels and legends limits contextual interpretation. The oscillations suggest a system with **high variability** or **instability**.
---
## Recommendations for Further Analysis
1. Add axis titles (e.g., "Time" for x-axis, "Amplitude" for y-axis) for clarity.
2. Include a legend to describe the line's significance.
3. Overlay a grid to improve readability of data points.
4. Provide numerical data or a formula for the plotted function.