## Bar Chart: Generative Accuracy by Transformation Type
### Overview
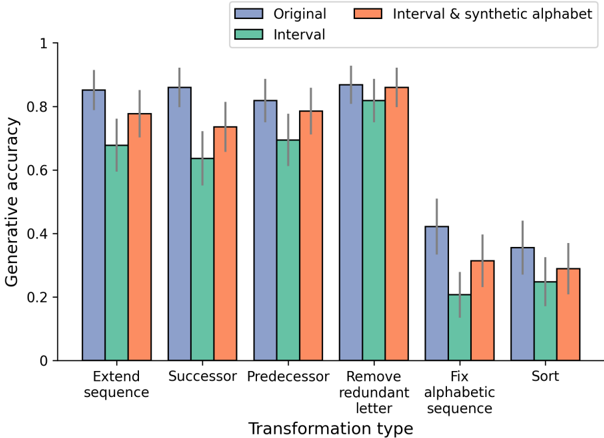
The image is a bar chart comparing the generative accuracy of three different methods ("Original", "Interval", and "Interval & synthetic alphabet") across six different transformation types: "Extend sequence", "Successor", "Predecessor", "Remove redundant letter", "Fix alphabetic sequence", and "Sort". The chart includes error bars, indicating the variability in the data.
### Components/Axes
* **Y-axis:** "Generative accuracy", ranging from 0 to 1 in increments of 0.2.
* **X-axis:** "Transformation type", with six categories: "Extend sequence", "Successor", "Predecessor", "Remove redundant letter", "Fix alphabetic sequence", and "Sort".
* **Legend:** Located at the top-right of the chart.
* Blue: "Original"
* Green: "Interval"
* Orange: "Interval & synthetic alphabet"
### Detailed Analysis
Here's a breakdown of the generative accuracy for each transformation type and method, including the approximate values and observed trends:
* **Extend sequence:**
* Original (Blue): Approximately 0.86, with error bars extending from approximately 0.8 to 0.92.
* Interval (Green): Approximately 0.68, with error bars extending from approximately 0.6 to 0.76.
* Interval & synthetic alphabet (Orange): Approximately 0.78, with error bars extending from approximately 0.7 to 0.86.
* **Successor:**
* Original (Blue): Approximately 0.87, with error bars extending from approximately 0.8 to 0.94.
* Interval (Green): Approximately 0.64, with error bars extending from approximately 0.56 to 0.72.
* Interval & synthetic alphabet (Orange): Approximately 0.74, with error bars extending from approximately 0.66 to 0.82.
* **Predecessor:**
* Original (Blue): Approximately 0.82, with error bars extending from approximately 0.74 to 0.90.
* Interval (Green): Approximately 0.70, with error bars extending from approximately 0.62 to 0.78.
* Interval & synthetic alphabet (Orange): Approximately 0.78, with error bars extending from approximately 0.7 to 0.86.
* **Remove redundant letter:**
* Original (Blue): Approximately 0.88, with error bars extending from approximately 0.8 to 0.96.
* Interval (Green): Approximately 0.83, with error bars extending from approximately 0.75 to 0.91.
* Interval & synthetic alphabet (Orange): Approximately 0.87, with error bars extending from approximately 0.79 to 0.95.
* **Fix alphabetic sequence:**
* Original (Blue): Approximately 0.43, with error bars extending from approximately 0.35 to 0.51.
* Interval (Green): Approximately 0.22, with error bars extending from approximately 0.14 to 0.30.
* Interval & synthetic alphabet (Orange): Approximately 0.32, with error bars extending from approximately 0.24 to 0.40.
* **Sort:**
* Original (Blue): Approximately 0.36, with error bars extending from approximately 0.28 to 0.44.
* Interval (Green): Approximately 0.26, with error bars extending from approximately 0.18 to 0.34.
* Interval & synthetic alphabet (Orange): Approximately 0.30, with error bars extending from approximately 0.22 to 0.38.
### Key Observations
* The "Original" method generally has the highest generative accuracy across all transformation types, except for "Remove redundant letter" where it is comparable to "Interval & synthetic alphabet".
* The "Fix alphabetic sequence" and "Sort" transformation types have significantly lower generative accuracy compared to the other transformation types for all three methods.
* The error bars suggest that there is some variability in the data, but the general trends are consistent across all transformation types.
### Interpretation
The data suggests that the "Original" method is generally more effective at generating accurate sequences compared to the "Interval" and "Interval & synthetic alphabet" methods. The lower accuracy for "Fix alphabetic sequence" and "Sort" indicates that these transformation types are more challenging for all three methods. The "Remove redundant letter" transformation type shows a high accuracy across all methods, suggesting it is a relatively easier task. The error bars provide a measure of the uncertainty in the data, which should be considered when interpreting the results.