# Technical Document Extraction: Receiver Operating Characteristic (ROC) Curve
## 1. Header Information
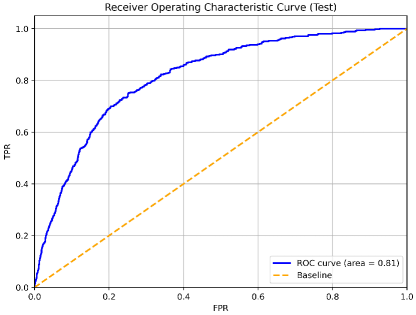
* **Title:** Receiver Operating Characteristic Curve (Test)
* **Language:** English
## 2. Chart Metadata and Axes
* **Chart Type:** ROC Curve (Line Graph)
* **X-Axis Label:** FPR (False Positive Rate)
* **X-Axis Scale:** 0.0 to 1.0 (increments of 0.2 marked, with grid lines every 0.2)
* **Y-Axis Label:** TPR (True Positive Rate)
* **Y-Axis Scale:** 0.0 to 1.0 (increments of 0.2 marked, with grid lines every 0.2)
* **Grid:** Present (major grid lines at 0.2 intervals for both axes)
## 3. Legend Analysis
* **Location:** Bottom-right corner
* **Series 1:**
* **Label:** ROC curve (area = 0.81)
* **Color/Style:** Solid dark blue line
* **Series 2:**
* **Label:** Baseline
* **Color/Style:** Dashed orange/gold line
## 4. Data Series and Trend Verification
### Series 1: ROC Curve (Solid Blue Line)
* **Trend Description:** The line originates at [0,0] and slopes steeply upward and to the right. It exhibits a concave downward shape, indicating that the True Positive Rate increases significantly faster than the False Positive Rate in the initial stages. The curve stays consistently above the baseline, eventually flattening out as it approaches the top-right corner [1,1].
* **Key Data Points (Estimated):**
* [0.0, 0.0]: Origin
* [0.1, 0.45]: Rapid initial ascent.
* [0.2, 0.70]: The "elbow" of the curve where the rate of TPR gain begins to slow relative to FPR.
* [0.4, 0.85]: Continued gradual ascent.
* [0.6, 0.93]: Approaching the upper limit.
* [0.8, 0.98]: Near-perfect TPR.
* [1.0, 1.0]: Termination point.
* **Performance Metric:** The Area Under the Curve (AUC) is explicitly stated as **0.81**, indicating a good predictive model performance.
### Series 2: Baseline (Dashed Orange Line)
* **Trend Description:** A perfectly linear diagonal line sloping upward at a 45-degree angle from the origin to the top-right corner.
* **Key Data Points:**
* [0.0, 0.0]
* [0.5, 0.5]
* [1.0, 1.0]
* **Significance:** This represents a "random guess" classifier with an AUC of 0.5.
## 5. Component Isolation Summary
* **Header:** Contains the descriptive title identifying the data as "Test" results.
* **Main Chart Area:** Displays the relationship between sensitivity (TPR) and 1-specificity (FPR). The blue curve's position significantly above the diagonal baseline confirms the model has discriminative power.
* **Footer/Legend:** Provides the quantitative evaluation (AUC = 0.81) and defines the visual encoding for the two plotted lines.