# Receiver Operating Characteristic Curve (Test) Analysis
## Key Components and Labels
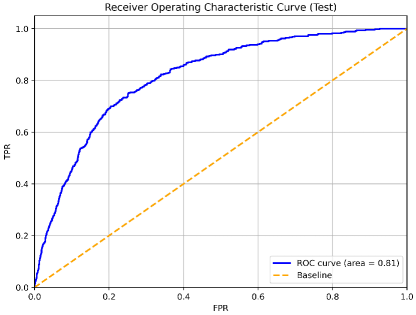
- **Title**: "Receiver Operating Characteristic Curve (Test)"
- **X-Axis**: Labeled "FPR" (False Positive Rate), ranging from 0.0 to 1.0 in increments of 0.2.
- **Y-Axis**: Labeled "TPR" (True Positive Rate), ranging from 0.0 to 1.0 in increments of 0.2.
- **Legend**: Located in the bottom-right corner of the plot.
- **Solid Blue Line**: Labeled "ROC curve (area = 0.81)".
- **Dashed Orange Line**: Labeled "Baseline".
## Chart Structure
1. **Header**: Contains the title "Receiver Operating Characteristic Curve (Test)".
2. **Main Chart**:
- **Axes**: Grid lines span from 0.0 to 1.0 on both axes.
- **Data Series**:
- **ROC Curve (Blue)**: A smooth, non-linear curve starting at (0,0) and ending at (1,1), with an area under the curve (AUC) of 0.81.
- **Baseline (Orange Dashed Line)**: A straight diagonal line from (0,0) to (1,1), representing a random classifier (AUC = 0.5).
## Spatial Grounding
- **Legend Placement**: Bottom-right corner of the plot.
- **Color Consistency**:
- Blue line matches "ROC curve" in the legend.
- Orange dashed line matches "Baseline" in the legend.
## Trend Verification
- **ROC Curve (Blue)**:
- **Trend**: Steeply ascends from (0,0) to (1,1), indicating high sensitivity and specificity.
- **Key Data Points**:
- At FPR = 0.0, TPR = 0.0.
- At FPR = 0.2, TPR ≈ 0.6.
- At FPR = 0.4, TPR ≈ 0.8.
- At FPR = 0.6, TPR ≈ 0.9.
- At FPR = 0.8, TPR ≈ 0.95.
- At FPR = 1.0, TPR = 1.0.
- **Baseline (Orange Dashed Line)**:
- **Trend**: Linear increase from (0,0) to (1,1), representing a 50% chance classifier.
## Additional Notes
- **AUC (Area Under Curve)**: The ROC curve's AUC is explicitly stated as 0.81, indicating strong model performance (closer to 1.0 is better).
- **Baseline AUC**: Implicitly 0.5, as it is a diagonal line.
## Language and Text Extraction
- **Primary Language**: English.
- **Transcribed Text**:
- "Receiver Operating Characteristic Curve (Test)"
- "FPR" (False Positive Rate)
- "TPR" (True Positive Rate)
- "ROC curve (area = 0.81)"
- "Baseline"
## Conclusion
The chart compares the performance of a classification model (ROC curve) against a random baseline. The model achieves an AUC of 0.81, significantly outperforming the baseline (AUC = 0.5). The ROC curve demonstrates high sensitivity and specificity across varying thresholds.