## Chart: Receiver Operating Characteristic (ROC) Curve
### Overview
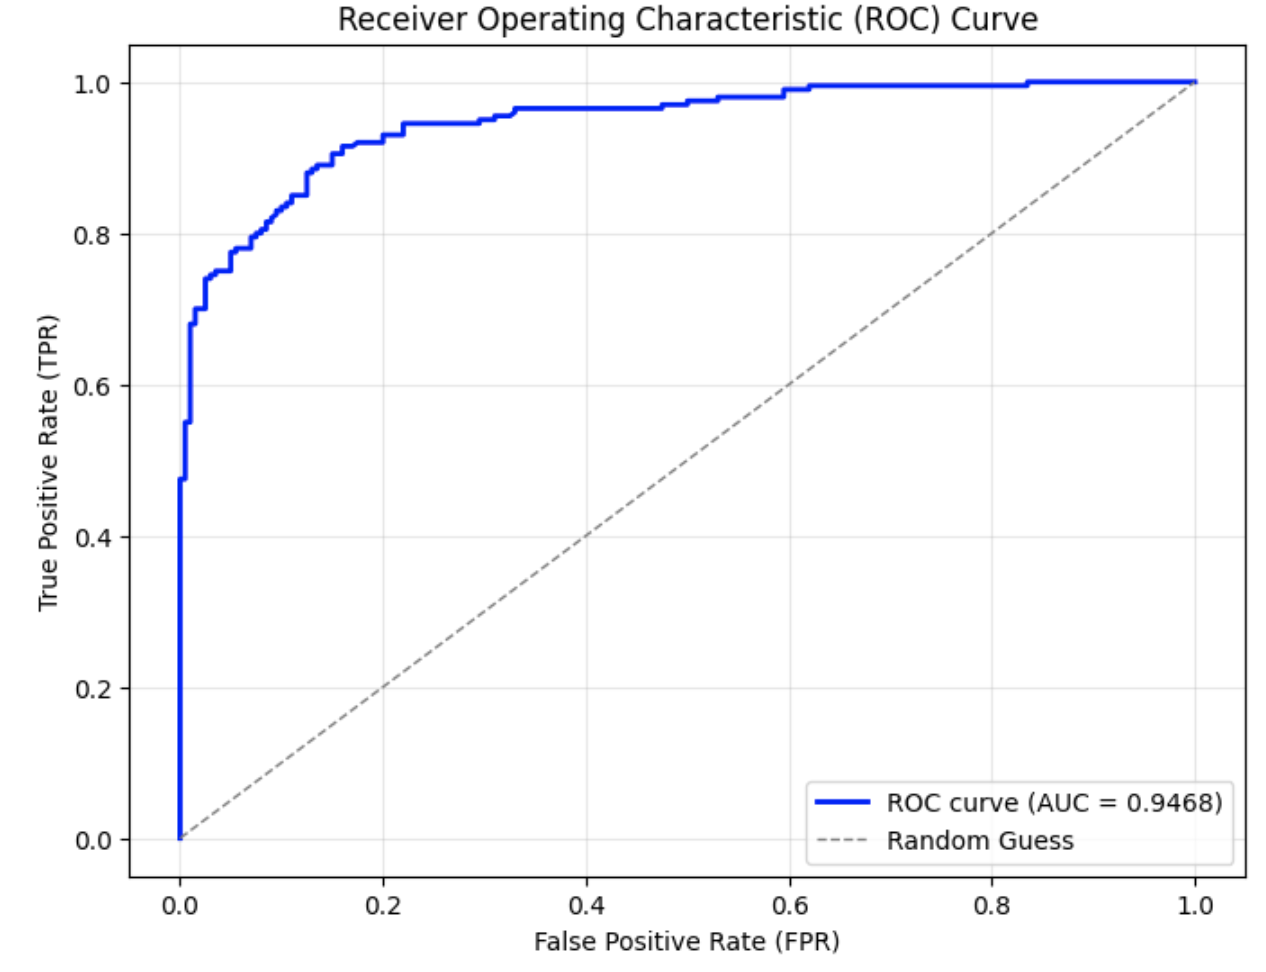
The image is a Receiver Operating Characteristic (ROC) curve, which plots the True Positive Rate (TPR) against the False Positive Rate (FPR). It visually represents the performance of a binary classification model. The plot includes the ROC curve itself, a diagonal line representing a random guess, and the Area Under the Curve (AUC) value for the ROC curve.
### Components/Axes
* **Title:** Receiver Operating Characteristic (ROC) Curve
* **X-axis:** False Positive Rate (FPR), ranging from 0.0 to 1.0 in increments of 0.2.
* **Y-axis:** True Positive Rate (TPR), ranging from 0.0 to 1.0 in increments of 0.2.
* **Legend:** Located in the bottom-right corner.
* Blue solid line: ROC curve (AUC = 0.9468)
* Gray dashed line: Random Guess
### Detailed Analysis
* **ROC Curve (Blue):** The blue line represents the ROC curve. It starts at (0.0, 0.0) and rises sharply to approximately (0.05, 0.75). It then continues to rise, but at a slower rate, reaching approximately (0.2, 0.92). From (0.2, 0.92) to (0.6, 0.98) the line rises slowly. Finally, it plateaus near 1.0 for FPR values greater than 0.6.
* **Random Guess (Gray):** The gray dashed line represents a random guess. It is a diagonal line from (0.0, 0.0) to (1.0, 1.0).
* **AUC Value:** The Area Under the Curve (AUC) for the ROC curve is 0.9468.
### Key Observations
* The ROC curve is significantly above the random guess line, indicating good performance of the classification model.
* The AUC value of 0.9468 is close to 1.0, which suggests that the model has a high ability to distinguish between positive and negative classes.
* The steep initial rise of the ROC curve indicates that the model achieves a high true positive rate with a relatively low false positive rate.
### Interpretation
The ROC curve and AUC value demonstrate that the classification model performs well. The model is able to effectively discriminate between positive and negative instances. The high AUC value suggests that the model is likely to generalize well to new, unseen data. The ROC curve's shape indicates that the model is particularly good at identifying true positives without generating many false positives, especially at lower FPR values.