## Chart/Diagram Type: Receiver Operating Characteristic (ROC) Curve
### Overview
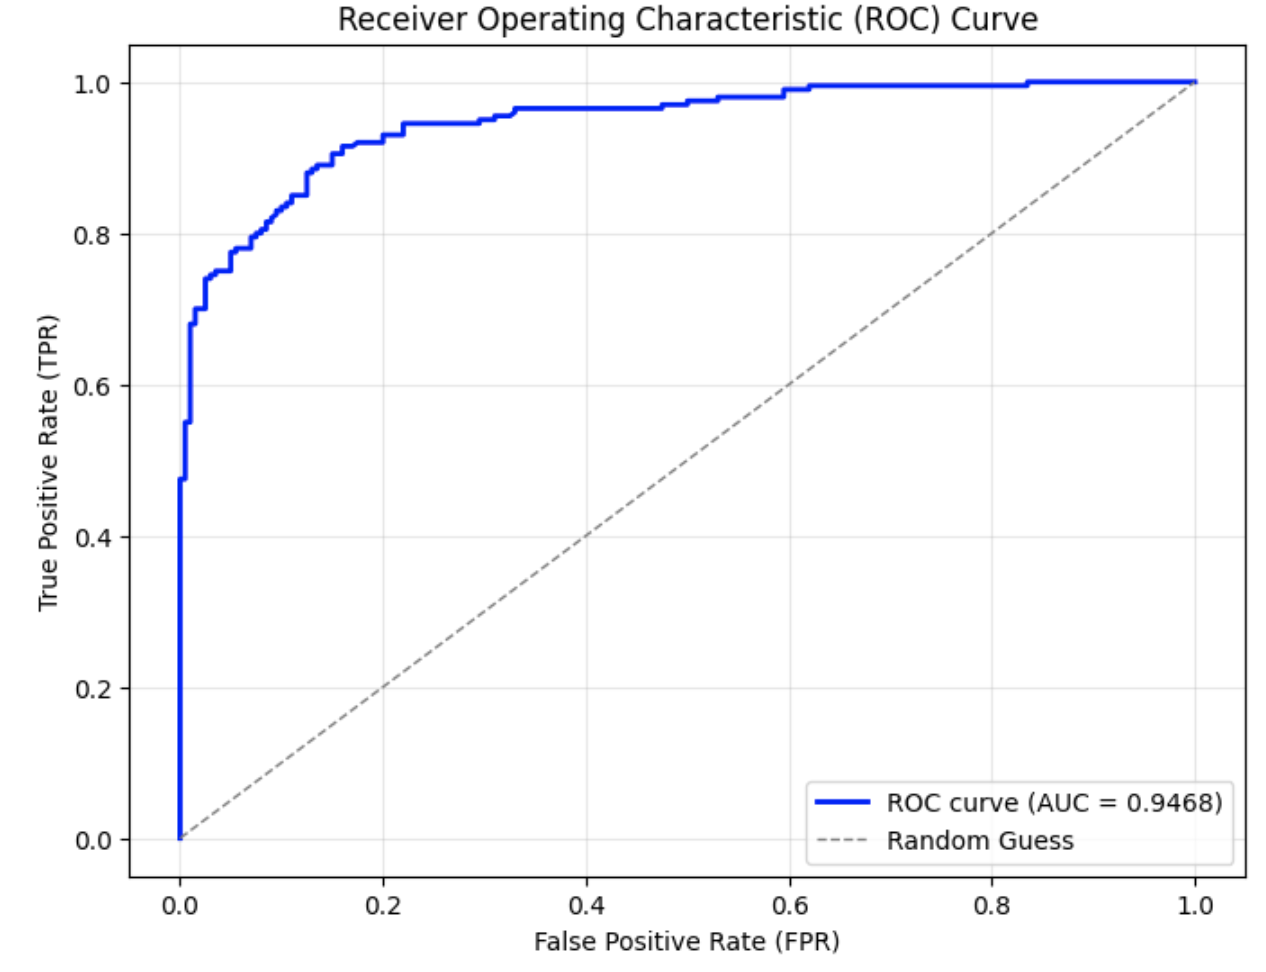
The image depicts a Receiver Operating Characteristic (ROC) curve, a graphical plot illustrating the diagnostic performance of a binary classification model. The curve compares the trade-off between the True Positive Rate (TPR) and False Positive Rate (FPR) at various threshold settings. A secondary dashed line represents a "Random Guess" baseline for comparison.
### Components/Axes
- **X-Axis**: Labeled "False Positive Rate (FPR)" with tick marks at 0.0, 0.2, 0.4, 0.6, 0.8, and 1.0.
- **Y-Axis**: Labeled "True Positive Rate (TPR)" with tick marks at 0.0, 0.2, 0.4, 0.6, 0.8, and 1.0.
- **Legend**: Located in the bottom-right corner, containing:
- Solid blue line: "ROC curve (AUC = 0.9468)"
- Dashed gray line: "Random Guess"
### Detailed Analysis
- **ROC Curve (Blue Line)**:
- Begins at (0.0, 0.0) and rises sharply to approximately (0.1, 0.5).
- Gradually increases to (1.0, 1.0), forming a concave curve.
- Key data points:
- (0.0, 0.0)
- (0.1, 0.5)
- (0.2, 0.8)
- (0.3, 0.9)
- (0.4, 0.95)
- (0.5, 0.97)
- (0.6, 0.98)
- (0.7, 0.99)
- (0.8, 1.0)
- (1.0, 1.0)
- The curve’s steep initial ascent indicates high sensitivity at low FPR, followed by a plateau as FPR increases.
- **Random Guess Line (Dashed Gray Line)**:
- A straight diagonal line from (0.0, 0.0) to (1.0, 1.0), representing a model with no discriminative ability.
### Key Observations
1. The ROC curve dominates the random guess line, confirming the model’s superior performance.
2. The AUC (Area Under the Curve) value of **0.9468** suggests excellent discriminative ability (AUC > 0.9 is considered strong).
3. The curve’s plateau near FPR > 0.4 indicates diminishing returns in TPR improvement at higher false positive rates.
### Interpretation
The ROC curve demonstrates that the model effectively distinguishes between positive and negative classes, with an AUC of 0.9468. This high value implies the model has strong predictive power, as it consistently achieves high TPR while maintaining low FPR across most thresholds. The sharp initial rise highlights the model’s ability to identify true positives early, while the gradual flattening suggests trade-offs at higher FPR thresholds. The random guess line serves as a critical benchmark, emphasizing that the model’s performance is not due to chance.
**Note**: All numerical values (e.g., AUC, FPR/TPR points) are approximate, derived from visual inspection of the curve’s trajectory and axis labels.