## Line Chart: CLD vs. Scale
### Overview
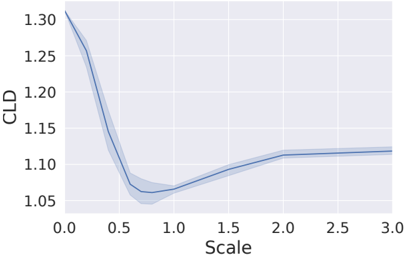
The image is a line chart showing the relationship between "CLD" (presumably some metric) and "Scale". The chart displays a single data series with a shaded region around the line, indicating uncertainty or variance. The line initially decreases sharply, reaches a minimum, and then gradually increases, plateauing towards the end of the scale.
### Components/Axes
* **X-axis:** "Scale", ranging from 0.0 to 3.0 in increments of 0.5.
* **Y-axis:** "CLD", ranging from 1.05 to 1.30 in increments of 0.05.
* **Data Series:** A single blue line with a shaded blue region around it, representing the CLD value at different scales.
### Detailed Analysis
* **Trend:** The blue line starts at a high CLD value at Scale 0.0, rapidly decreases until approximately Scale 0.8, then gradually increases and flattens out after Scale 2.0.
* **Data Points:**
* At Scale 0.0, CLD is approximately 1.30.
* At Scale 0.5, CLD is approximately 1.15.
* At Scale 0.8, CLD reaches a minimum of approximately 1.06.
* At Scale 1.0, CLD is approximately 1.07.
* At Scale 1.5, CLD is approximately 1.09.
* At Scale 2.0, CLD is approximately 1.11.
* At Scale 2.5, CLD is approximately 1.12.
* At Scale 3.0, CLD is approximately 1.12.
* **Uncertainty:** The shaded region around the blue line indicates the uncertainty or variability in the CLD values. The uncertainty appears to be larger in the region where the CLD value is decreasing rapidly (between Scale 0.0 and 0.8).
### Key Observations
* The CLD value is minimized around Scale 0.8.
* The CLD value plateaus after Scale 2.0.
* The uncertainty in the CLD value is higher when the CLD is changing rapidly.
### Interpretation
The chart suggests that there is an optimal "Scale" value (around 0.8) that minimizes the "CLD" metric. Increasing the scale beyond this point results in a gradual increase in CLD, eventually plateauing. The shaded region indicates the variability or uncertainty in the CLD values, which is higher when the CLD is changing rapidly. This could indicate that the relationship between Scale and CLD is more sensitive in this region. The plateauing of CLD after Scale 2.0 suggests that further increases in scale do not significantly affect the CLD value.