## Line Chart with Confidence Band: CLD vs. Scale
### Overview
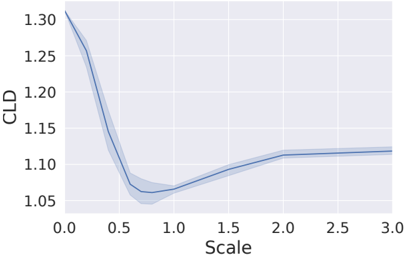
The image displays a line chart plotting a variable labeled "CLD" against a variable labeled "Scale." The chart features a single data series represented by a solid blue line, accompanied by a light blue shaded region indicating a confidence interval or range of uncertainty around the central trend.
### Components/Axes
* **X-Axis (Horizontal):**
* **Label:** "Scale"
* **Range:** 0.0 to 3.0
* **Major Tick Marks:** 0.0, 0.5, 1.0, 1.5, 2.0, 2.5, 3.0
* **Y-Axis (Vertical):**
* **Label:** "CLD"
* **Range:** Approximately 1.05 to 1.30
* **Major Tick Marks:** 1.05, 1.10, 1.15, 1.20, 1.25, 1.30
* **Data Series:**
* A single solid blue line representing the primary trend.
* A light blue shaded area surrounding the line, representing the confidence band or uncertainty range.
* **Legend:** No separate legend is present. The single data series and its associated uncertainty band are the only plotted elements.
* **Grid:** A faint gray grid is present in the background, aligned with the major tick marks on both axes.
### Detailed Analysis
**Trend Verification:** The blue line exhibits a distinct non-linear trend. It begins at a high value on the left, descends steeply to a minimum, and then ascends gradually before plateauing.
**Key Data Points (Approximate):**
* At **Scale = 0.0**, CLD is at its maximum, approximately **1.30**.
* The line descends sharply. At **Scale = 0.5**, CLD has fallen to approximately **1.10**.
* The minimum (trough) of the curve occurs between Scale 0.5 and 1.0. The lowest point appears to be at approximately **Scale = 0.75**, where CLD is approximately **1.06**.
* After the minimum, the line begins a gradual ascent. At **Scale = 1.0**, CLD is approximately **1.07**.
* At **Scale = 1.5**, CLD is approximately **1.10**.
* The ascent continues but the slope decreases. At **Scale = 2.0**, CLD is approximately **1.12**.
* From Scale 2.0 to 3.0, the line shows a very slight upward trend, appearing to plateau. At **Scale = 3.0**, CLD is approximately **1.125**.
**Confidence Band Analysis:**
* The shaded uncertainty band is narrowest at the start (Scale 0.0) and end (Scale 3.0) of the plotted range.
* The band is **widest around the minimum point** (Scale ~0.75), indicating the greatest uncertainty or variability in the CLD measurement at this scale.
* The band narrows again as the scale increases beyond 1.5.
### Key Observations
1. **Non-Monotonic Relationship:** The relationship between Scale and CLD is not linear or simply increasing/decreasing. It features a clear minimum.
2. **Steep Initial Decline:** The most dramatic change in CLD occurs for small Scale values (0.0 to ~0.75).
3. **Asymptotic Behavior:** For Scale values greater than 2.0, the CLD value changes very little, suggesting an asymptotic approach to a stable value around 1.12-1.13.
4. **Variable Uncertainty:** The precision of the CLD estimate (as indicated by the confidence band width) is not constant; it is poorest at the point of the minimum CLD value.
### Interpretation
This chart likely illustrates the result of an optimization or sensitivity analysis. The "Scale" parameter is being varied to observe its effect on a metric called "CLD."
* **What the data suggests:** There exists an **optimal Scale value around 0.75** that minimizes the CLD metric. Deviating from this value in either direction (smaller or larger Scale) results in a higher CLD.
* **How elements relate:** The steep descent indicates that CLD is highly sensitive to Scale when Scale is small. The plateau suggests that beyond a certain point (Scale > 2.0), further increases in Scale have a negligible impact on CLD.
* **Notable anomaly/feature:** The **widening of the confidence band at the minimum** is a critical observation. It implies that while the *average* CLD is lowest at Scale ~0.75, the *predictability* or *consistency* of achieving that low value is also at its worst. This could indicate a region of instability or high sensitivity to other uncontrolled variables in the underlying process.
* **Practical implication:** If minimizing CLD is the goal, a Scale near 0.75 is target. However, the high uncertainty at this point might necessitate additional controls or a trade-off consideration, perhaps opting for a slightly higher Scale (e.g., 1.0-1.5) where the CLD is only marginally higher but the outcome is more predictable (narrower confidence band).