## Line Chart: CLD vs. Scale
### Overview
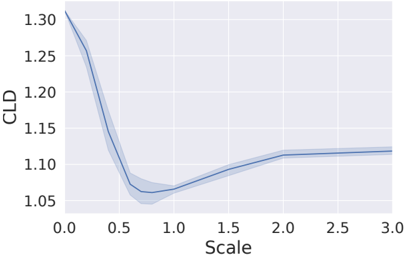
The image depicts a line chart with a shaded confidence interval, illustrating the relationship between "Scale" (x-axis) and "CLD" (y-axis). The line shows a non-linear trend with a sharp initial decline, followed by stabilization. The shaded area represents uncertainty or variability in the data.
### Components/Axes
- **X-axis (Scale)**: Ranges from 0.0 to 3.0 in increments of 0.5. Labels: 0.0, 0.5, 1.0, 1.5, 2.0, 2.5, 3.0.
- **Y-axis (CLD)**: Ranges from 1.05 to 1.30 in increments of 0.05. Labels: 1.05, 1.10, 1.15, 1.20, 1.25, 1.30.
- **Legend**: No explicit legend is present, but the shaded area likely represents a confidence interval (e.g., ±0.05 or similar).
- **Line**: Blue line with a shaded blue region (lighter blue) indicating variability.
### Detailed Analysis
- **Initial Decline (0.0–1.0)**:
- At **Scale = 0.0**, CLD starts at **1.30**.
- By **Scale = 0.5**, CLD drops to **~1.15**.
- At **Scale = 1.0**, CLD reaches a minimum of **~1.05**.
- The shaded area is widest at the start (0.0–0.5) and narrows as the line descends.
- **Stabilization (1.0–3.0)**:
- From **Scale = 1.0 to 1.5**, CLD rises slightly to **~1.10**.
- From **Scale = 1.5 to 3.0**, CLD plateaus at **~1.11**.
- The shaded area remains narrow, indicating low variability in this range.
### Key Observations
1. **Sharp Initial Drop**: CLD decreases rapidly from 1.30 to 1.05 as Scale increases from 0.0 to 1.0.
2. **Plateau Phase**: CLD stabilizes around 1.11 for Scale ≥ 1.5, suggesting diminishing returns or saturation.
3. **Uncertainty Pattern**: The shaded area (confidence interval) is widest at the start and narrowest at the minimum point (Scale = 1.0), implying higher confidence in measurements at higher scales.
### Interpretation
The data suggests that CLD is inversely related to Scale initially, with a significant reduction observed as Scale increases from 0.0 to 1.0. Beyond this point, CLD stabilizes, indicating that further increases in Scale have minimal impact. The narrowing confidence interval at higher scales implies improved measurement precision or reduced variability in the system being studied. This could reflect a threshold effect, where the influence of Scale on CLD diminishes after a critical point. The initial uncertainty highlights potential variability in early-stage measurements, which becomes more consistent as Scale increases.