# Technical Document Extraction: MATH Benchmark Performance (gemini-1.5-pro-002)
## 1. Header Information
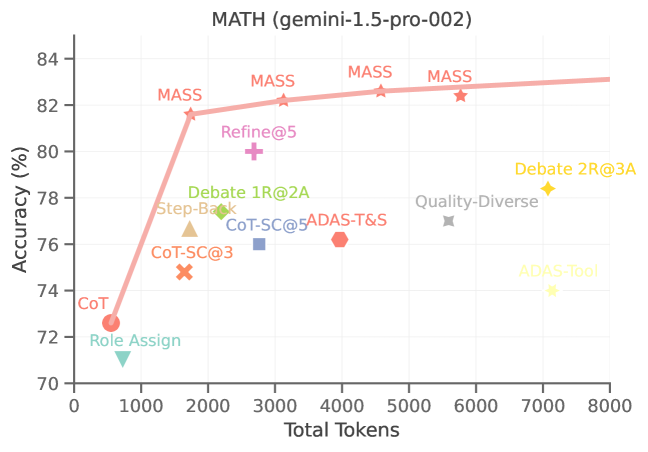
* **Title:** MATH (gemini-1.5-pro-002)
* **Subject:** Performance comparison of various prompting and reasoning methods on the MATH benchmark using the Gemini 1.5 Pro 002 model.
## 2. Axis Definitions
* **Y-Axis (Vertical):** Accuracy (%)
* **Range:** 70% to 84%
* **Markers:** Increments of 2 (70, 72, 74, 76, 78, 80, 82, 84)
* **X-Axis (Horizontal):** Total Tokens
* **Range:** 0 to 8000
* **Markers:** Increments of 1000 (0, 1000, 2000, 3000, 4000, 5000, 6000, 7000, 8000)
## 3. Main Chart Analysis: Data Series and Trends
The chart is a scatter plot with a primary Pareto frontier line representing the "MASS" method.
### A. The MASS Pareto Frontier (Primary Trend)
* **Visual Trend:** A light red solid line that slopes sharply upward from ~500 tokens to ~1800 tokens, then transitions into a very gradual upward slope (plateauing) as token count increases toward 8000.
* **Data Points (Red Stars/Circles):**
1. **CoT (Circle):** Located at approx. [550, 72.6]. This serves as the baseline.
2. **MASS (Star 1):** Located at approx. [1750, 81.6]. Represents a significant accuracy jump for a moderate token increase.
3. **MASS (Star 2):** Located at approx. [3100, 82.2].
4. **MASS (Star 3):** Located at approx. [4600, 82.6].
5. **MASS (Star 4):** Located at approx. [5800, 82.4]. (Note: Slight dip or variance, but the trend line continues to rise slightly toward 83% at 8000 tokens).
### B. Comparative Methods (Individual Data Points)
These points represent alternative strategies, all falling below the MASS frontier line, indicating lower efficiency (lower accuracy for the same or higher token cost).
| Label | Marker Shape | Color | Approx. X (Tokens) | Approx. Y (Accuracy %) |
| :--- | :--- | :--- | :--- | :--- |
| **Role Assign** | Downward Triangle | Teal | 750 | 71.0% |
| **CoT-SC@3** | X-mark | Orange | 1650 | 74.8% |
| **Step-Back** | Upward Triangle | Tan | 1750 | 76.6% |
| **Debate 1R@2A** | Diamond | Light Green | 2200 | 77.4% |
| **CoT-SC@5** | Square | Blue-Grey | 2750 | 76.0% |
| **Refine@5** | Plus (+) | Pink | 2700 | 80.0% |
| **ADAS-T&S** | Hexagon | Coral | 4000 | 76.2% |
| **Quality-Diverse** | 4-point Star | Grey | 5600 | 77.0% |
| **Debate 2R@3A** | Diamond | Yellow | 7100 | 78.4% |
| **ADAS-Tool** | Hexagon | Pale Yellow | 7150 | 74.0% |
## 4. Component Isolation & Spatial Grounding
* **Header:** Contains the title centered at the top.
* **Main Chart Area:** Occupies the central [x, y] coordinate space. The grid lines are light grey, appearing every 1000 tokens (X) and 2% accuracy (Y).
* **Legend/Labels:** There is no separate legend box. Labels are placed immediately adjacent to or above their respective data points for direct identification.
* **Trend Verification:** The "MASS" series (red line) consistently outperforms all other methods across the entire token spectrum shown. For example, at ~2700 tokens, "Refine@5" achieves 80% accuracy, while the MASS trend line is already above 81.5%.
## 5. Summary of Findings
The data demonstrates that the **MASS** method is the most token-efficient strategy for the Gemini-1.5-pro-002 model on the MATH benchmark. It achieves a high accuracy of over 81% with fewer than 2000 tokens, whereas other methods like "Debate 2R@3A" require over 7000 tokens to reach only 78.4% accuracy. The "Refine@5" method is the closest competitor in terms of efficiency but still falls below the MASS frontier.