\n
## Scatter Plot: Accuracy vs. Time-to-Answer
### Overview
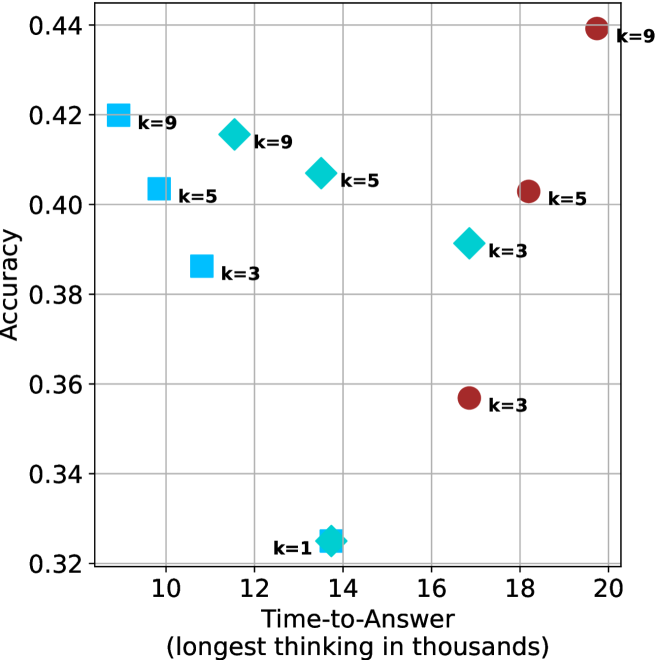
The image presents a scatter plot illustrating the relationship between Accuracy and Time-to-Answer (measured in thousands of units). The data points are differentiated by the value of 'k', representing a parameter. There are two distinct marker shapes: squares (blue) and circles (red).
### Components/Axes
* **X-axis:** Time-to-Answer (longest thinking in thousands). Scale ranges from approximately 9 to 20.
* **Y-axis:** Accuracy. Scale ranges from approximately 0.32 to 0.44.
* **Data Series:** Represented by different marker shapes and colors, categorized by the value of 'k'.
* k=1 (Teal Square)
* k=3 (Blue Square & Red Circle)
* k=5 (Blue Square & Red Circle)
* k=9 (Teal Diamond & Red Circle)
* **Labels:** Each data point is labeled with its corresponding 'k' value.
### Detailed Analysis
The plot contains data points for k=1, k=3, k=5, and k=9.
* **k=1:** One data point at approximately (13.5, 0.325).
* **k=3:** Two data points: a blue square at approximately (11.5, 0.39) and a red circle at approximately (17.5, 0.36).
* **k=5:** Two data points: a blue square at approximately (11.5, 0.41) and a red circle at approximately (18.5, 0.40).
* **k=9:** Two data points: a teal diamond at approximately (12.5, 0.425) and a red circle at approximately (20, 0.435).
**Trends:**
* For k=3, the accuracy generally increases with time-to-answer, as the blue square has a lower time-to-answer and lower accuracy than the red circle.
* For k=5, the accuracy is relatively stable across the two points.
* For k=9, the accuracy increases with time-to-answer.
* The blue squares (k=3 and k=5) generally cluster together in the bottom-left portion of the plot.
* The red circles (k=3, k=5, and k=9) are more dispersed, appearing in the bottom-right and top-right portions of the plot.
### Key Observations
* There's a noticeable separation between the blue squares and red circles, suggesting that the marker shape (or the underlying process it represents) has a significant impact on the relationship between accuracy and time-to-answer.
* The data points for k=9 show a positive correlation between time-to-answer and accuracy.
* The data points for k=3 and k=5 show a more complex relationship, with some variation in accuracy at different time-to-answer values.
### Interpretation
The data suggests that the parameter 'k' influences both the accuracy and the time-to-answer. The different marker shapes (squares vs. circles) likely represent different approaches or algorithms. The squares (lower k values) appear to achieve reasonable accuracy with relatively faster response times, while the circles (higher k values) may require more time to achieve higher accuracy.
The positive correlation observed for k=9 indicates that increasing the time-to-answer can lead to improved accuracy for that specific parameter value. The variation in accuracy for k=3 and k=5 suggests that other factors may also play a role in determining the overall performance.
The separation between the blue squares and red circles could indicate that the two approaches are fundamentally different, with the squares representing a more efficient but potentially less accurate method, and the circles representing a more thorough but potentially slower method. Further investigation would be needed to understand the underlying mechanisms driving these differences.