## Scatter Plot: Accuracy vs. Time-to-Answer (Longest in Thousands)
### Overview
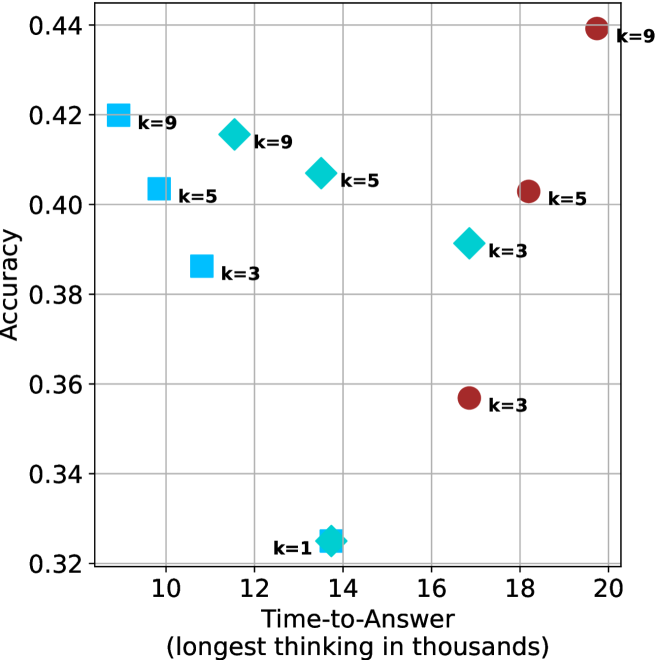
The image is a scatter plot comparing **Accuracy** (y-axis) and **Time-to-Answer (longest in thousands)** (x-axis). Data points are color-coded and labeled with different **k-values** (k=9, k=5, k=3, k=1), each represented by distinct markers (circles, squares, diamonds, stars). The plot highlights a trade-off between accuracy and computational time, with higher k-values generally associated with higher accuracy but longer processing times.
---
### Components/Axes
- **X-axis (Time-to-Answer)**: Labeled "Time-to-Answer (longest in thousands)" with values ranging from 10 to 20 (in thousands).
- **Y-axis (Accuracy)**: Labeled "Accuracy" with values ranging from 0.32 to 0.44.
- **Legend**: Located on the right side of the plot.
- **k=9**: Red circles.
- **k=5**: Blue squares.
- **k=3**: Cyan diamonds.
- **k=1**: Star symbol (cyan).
---
### Detailed Analysis
#### Data Points and Trends
1. **k=9 (Red Circles)**:
- Points at (10, 0.42), (12, 0.42), (14, 0.42), and (19, 0.44).
- **Trend**: Accuracy remains stable at ~0.42 for lower time values (10–14k) but increases slightly to 0.44 at 19k.
2. **k=5 (Blue Squares)**:
- Points at (10, 0.40), (12, 0.40), (14, 0.40), and (18, 0.40).
- **Trend**: Consistent accuracy of 0.40 across all time values.
3. **k=3 (Cyan Diamonds)**:
- Points at (10, 0.38), (14, 0.38), and (18, 0.36).
- **Trend**: Accuracy decreases slightly from 0.38 to 0.36 as time increases.
4. **k=1 (Star)**:
- Single point at (14, 0.32).
- **Trend**: Outlier with the lowest accuracy and moderate time-to-answer.
#### Spatial Grounding
- **Legend**: Positioned on the right side of the plot, clearly associating colors/markers with k-values.
- **Data Points**:
- k=9 points are clustered in the upper-right quadrant (high accuracy, high time).
- k=5 points are spread across the middle of the plot (moderate accuracy, moderate time).
- k=3 points are in the lower-middle region (lower accuracy, moderate time).
- k=1 is an isolated point in the lower-middle region.
---
### Key Observations
1. **Accuracy-Time Trade-off**:
- Higher k-values (e.g., k=9) achieve higher accuracy but require significantly longer processing times.
- Lower k-values (e.g., k=1) have lower accuracy but shorter processing times.
2. **Outliers**:
- The k=1 point (14k, 0.32) is an outlier, suggesting a potential anomaly or suboptimal configuration.
3. **Consistency**:
- k=5 maintains stable accuracy (0.40) across all time values, indicating robustness.
- k=9 shows a slight upward trend in accuracy at higher time values.
---
### Interpretation
The plot demonstrates a clear **trade-off between accuracy and computational efficiency**. Higher k-values (e.g., k=9) improve accuracy but at the cost of increased time-to-answer, which may be critical in real-time applications. The k=5 configuration offers a balanced performance, maintaining consistent accuracy without excessive delays. The k=1 outlier highlights the risks of underfitting or insufficient model complexity.
The data suggests that optimizing k-values requires balancing the need for accuracy with practical constraints on processing time. Further analysis could explore whether the k=9 trend at 19k represents a plateau or a potential overfitting scenario.