## Diagram: Tokenizer and Evaluation Process
### Overview
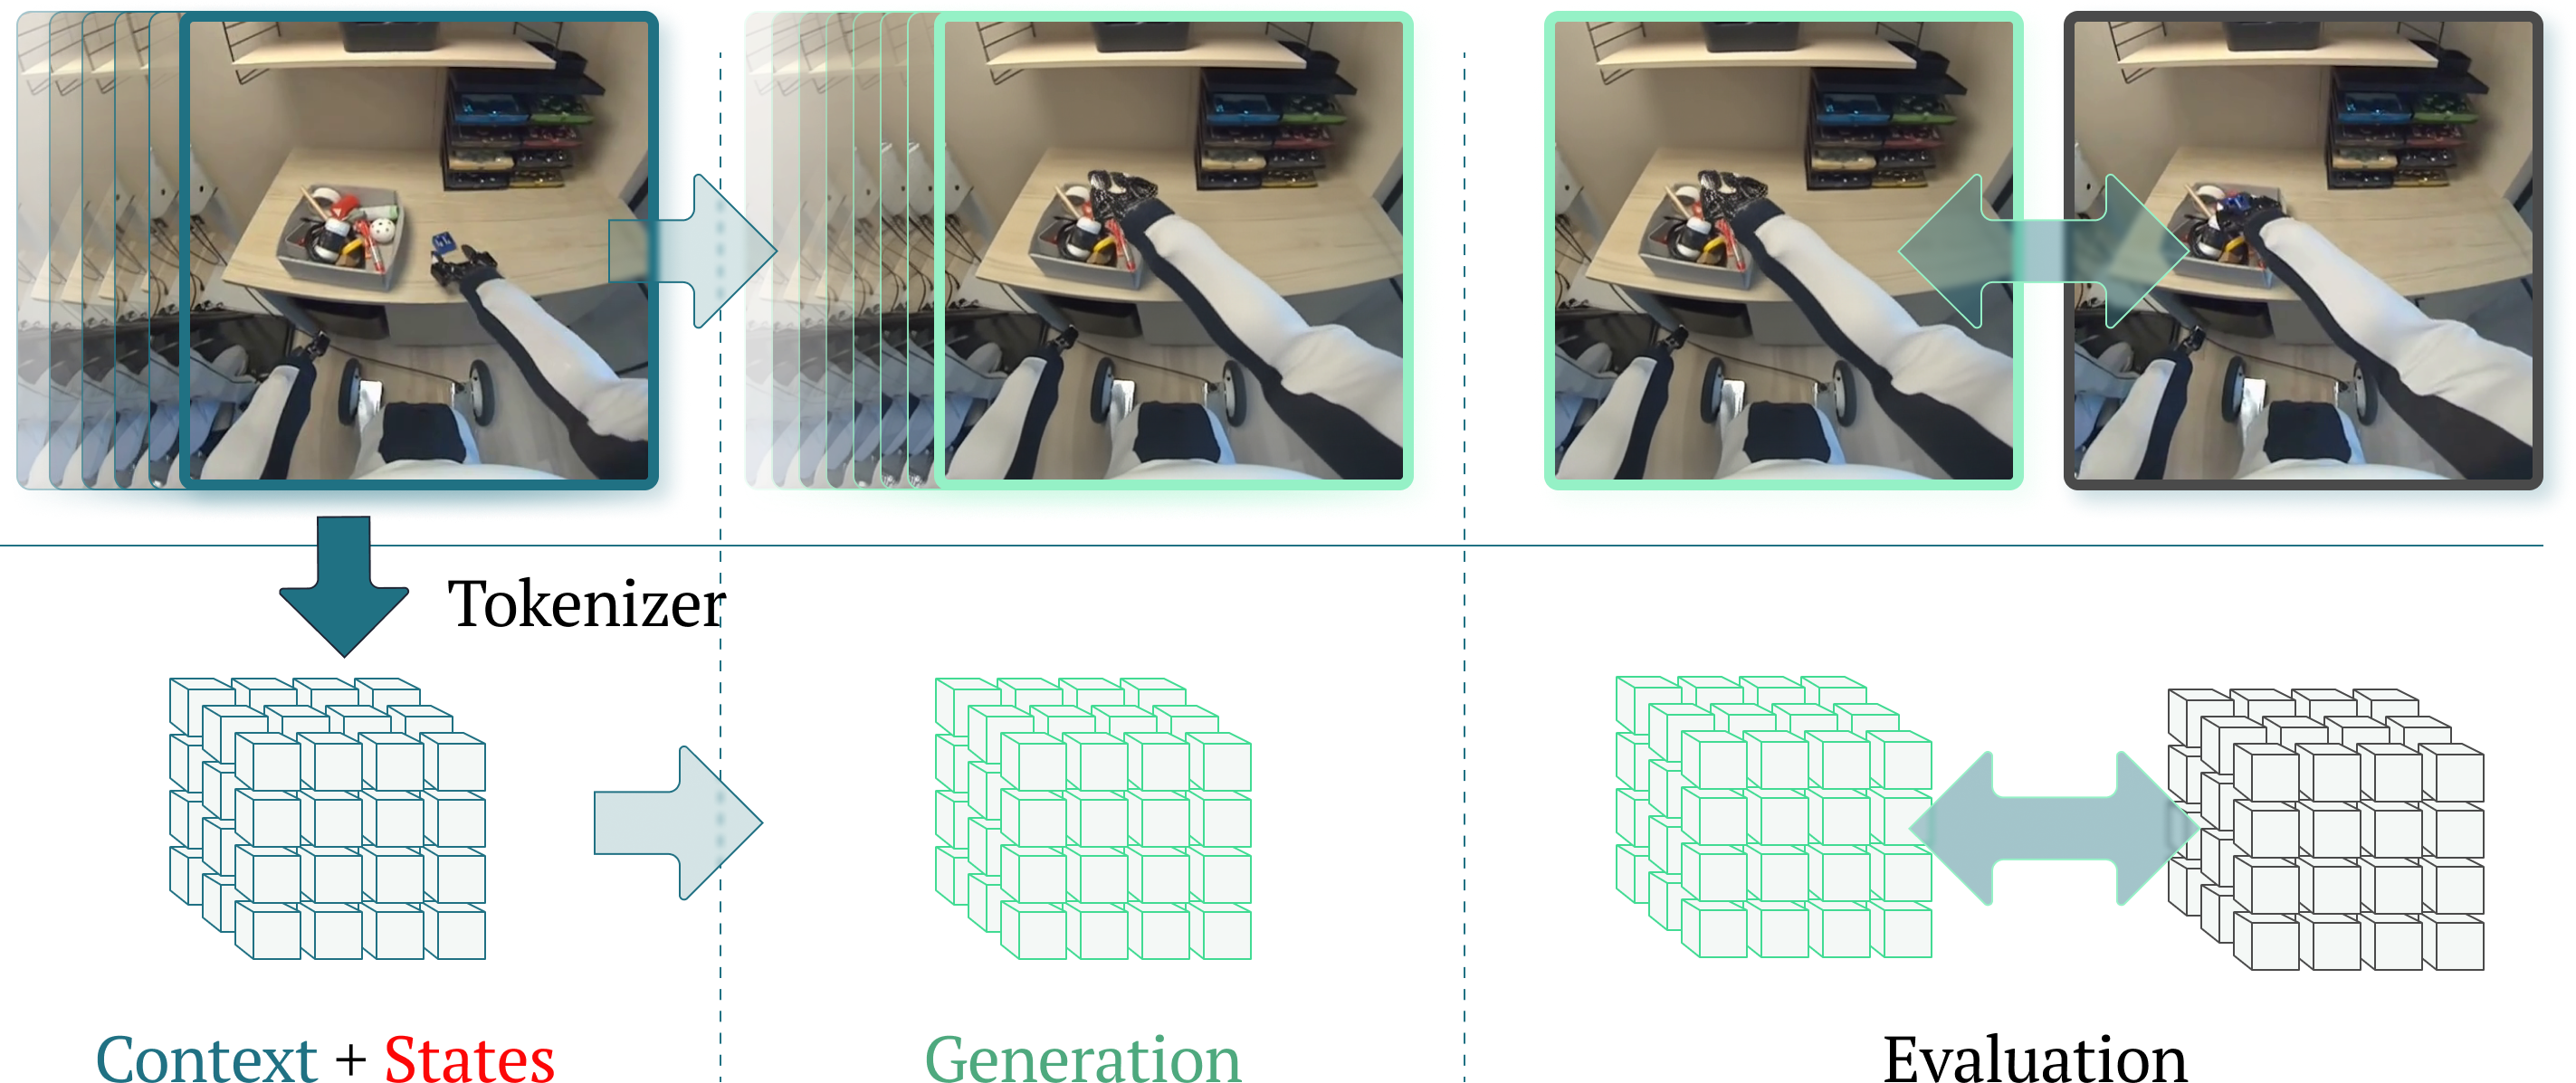
The image illustrates a process involving a tokenizer, generation, and evaluation, likely within a machine learning or robotics context. It shows a sequence of actions involving a robotic arm interacting with objects, followed by data processing steps.
### Components/Axes
* **Top Row:** Sequence of images showing a robotic arm interacting with objects on a table. The images are framed with different colored borders (teal, light green, light green, dark gray). Arrows indicate the flow of the process.
* **Tokenizer:** Text label positioned below the first image sequence. A downward-pointing teal arrow connects the image sequence to a 3D cube representation.
* **Context + States:** Text label in red and teal, positioned below the 3D cube representation associated with the tokenizer.
* **Generation:** Text label in green, positioned below the second 3D cube representation.
* **Evaluation:** Text label in black, positioned below the third 3D cube representation.
* **3D Cube Representations:** Three sets of cubes, each associated with a different stage (Tokenizer, Generation, Evaluation). The first set is teal, the second is light green, and the third is gray.
* **Arrows:** Arrows indicate the flow of data/process between the stages. A teal arrow points from the first image sequence to the first cube representation. A light green arrow points from the first cube representation to the second. A light green double-headed arrow connects the second and third cube representations.
### Detailed Analysis
* **Image Sequence 1 (Top-Left):** Shows a robotic arm reaching into a container with various objects. The image is framed in teal. Multiple ghosted images are overlaid, showing the arm's movement.
* **Image Sequence 2 (Top-Middle-Left):** Shows a robotic arm holding an object from the container. The image is framed in light green. Multiple ghosted images are overlaid, showing the arm's movement.
* **Image Sequence 3 (Top-Middle-Right):** Shows a robotic arm holding an object from the container. The image is framed in light green.
* **Image Sequence 4 (Top-Right):** Shows a robotic arm holding an object from the container. The image is framed in dark gray.
* **Tokenizer Stage:** The "Tokenizer" stage takes the image sequence as input and converts it into a 3D cube representation labeled "Context + States".
* **Generation Stage:** The "Generation" stage takes the output from the "Tokenizer" stage and generates a new 3D cube representation.
* **Evaluation Stage:** The "Evaluation" stage compares the "Generation" output with a final 3D cube representation.
### Key Observations
* The diagram illustrates a sequential process.
* The color of the frames and 3D cube representations changes as the process progresses (teal -> light green -> dark gray).
* The robotic arm interaction with objects is the initial input to the process.
* The 3D cube representations likely symbolize data or states at different stages.
### Interpretation
The diagram likely represents a machine learning or robotics pipeline where a robotic arm's actions are captured as images, tokenized into a state representation, used for generation, and then evaluated. The "Tokenizer" stage likely converts the visual input into a numerical or symbolic representation that can be processed by subsequent stages. The "Generation" stage might involve predicting the next action or state based on the context. The "Evaluation" stage assesses the quality or accuracy of the generated output. The color changes could represent different levels of processing or confidence in the data.